
MINDset

I developed MINDset to be a series of data visualization sculptures that chronicled my evolving state of mind. Much like a diary makes retrospection clearer, I wanted to record my state of mind. I envisioned a visual system that could be displayed to others and rather than wading around your mind for a way to truly answer “How are you doing?” you could share a physical artifact that the person could inspect, touch, get close to, examine in relation to space, and answer the question for themselves. Conversely, one could keep the sculptures for their own introspection and keep the meaning secret to themselves like a diary. My goals were to create a visual system that effectively communicated my data points, tell a narrative story in a physical form, and encourage users to inspect the nature of one’s state of mind.
Summary
Primary goal: Use qualitative and quantitative data to track my state of mind
Secondary goal: Create a visual system to display the collected data
Form: Fabricated sculpture and augmented reality
Why a physical form?
Our traditional relationship with data is limiting. We tend to think the only way to display data is a static chart or graph. Data is just a number or a unit. I’m more interested in the relationships and stories data can tell. I’d like to challenge users to reimagine data as something malleable rather than rigid.
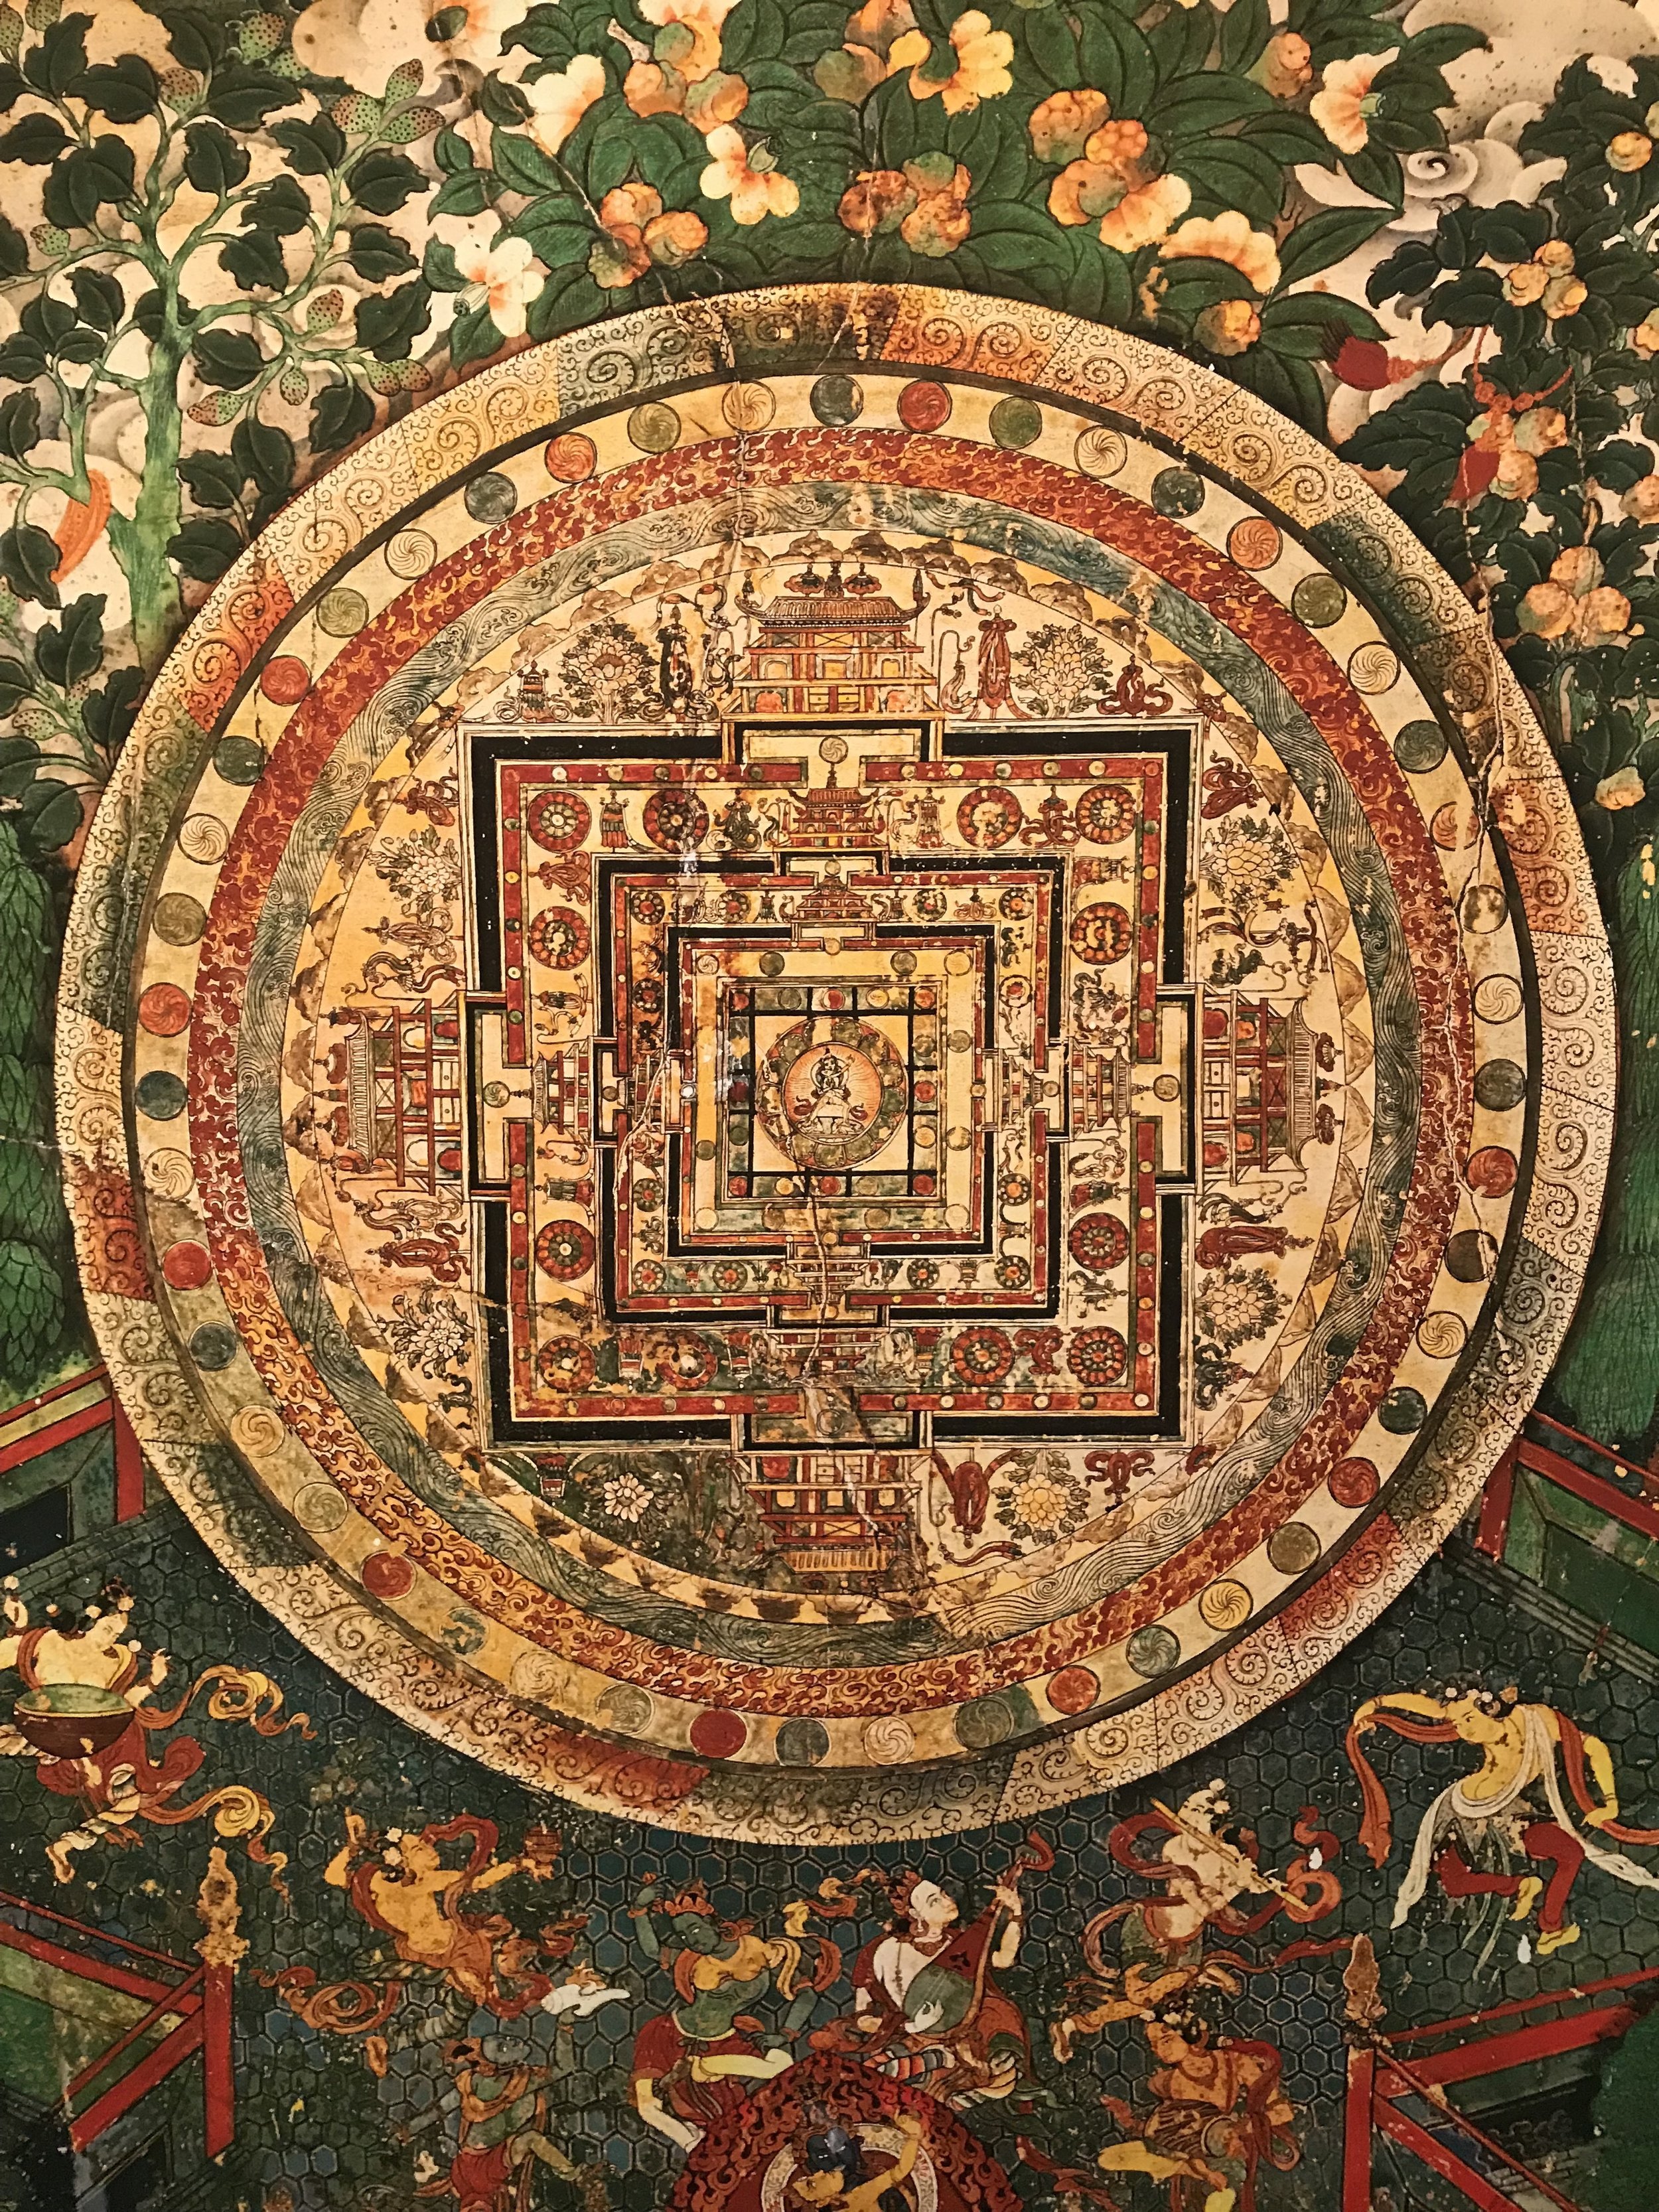
I’ve been inspired by data visualizations that discard traditional graphical depictions. I think data can tell a rich, visual story when anchored to the concepts that the data is analyzing so I sought to create sculptures in the form of mandalas because of their metaphorical significance. Mandalas depict the state of self and larger themes that are central to a mindfulness practices in Buddhism. In this article, I detail my design inspirations and break down my process.
Inspiration

Wearable Self by Jiyeon Kang

Data Crystals by Scott Kildall

Bruises- That We Don't See by Giorgia Lupi
I took inspiration from three primary design precedents: Wearable Self by Jiyeon Kang, Data Crystals by Scott Kildall, and Bruises- That We Don’t See by Giorgia Lupi and Kaki King. I won’t go into detail on each project but I encourage you to check them out. Each example exemplifies utilizing data visualization in a non-traditional form. In the examples of Kang and Kildall- data becomes a physical artifact. In the case of Lupi and Kang- data becomes a rich, emotional story translated into a visual system.
Graphs are boring. Even abstract computer animations have lost some of their novelty. I wanted the construction of this piece to be deliberate and interpretable but reflect the abstract nature of the data. I focused my design on furthering the exploration of converting data into something physical and creating new visual systems that go beyond the typical graph.
Process


Developing MINDset was a fairly iterative process. In its earliest concept, I envisioned MINDset being a collage 3D printed objects. My original idea was a collection of flowers where the size, type, and color of each flower would communicate data related to my meditation practice. The form of the flower was related to my desire to represent my state of mind in a positive form no matter how tumultuous it felt at the time. After feedback, I realized that the form distracted from the concept so I sought a form that was more universal to the concept of mindfulness- mandalas.
The form
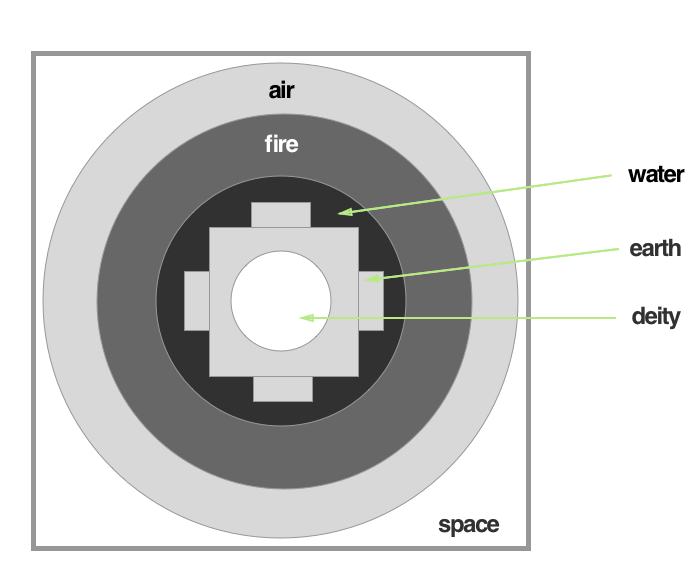
Creating mandalas is an ancient Buddhist practice. A mandala’s form and purpose typically depends on the creator’s goal. Each layer of the mandala represents different ideas and is traditionally used as an aid for meditation and understanding one’s place within the larger universe. Mandalas are usually 2D representations of 3D layers. I decided to draw on the traditional symbolism of the mandala and translate that symbolism to aspects of my state of mind (see figures below).
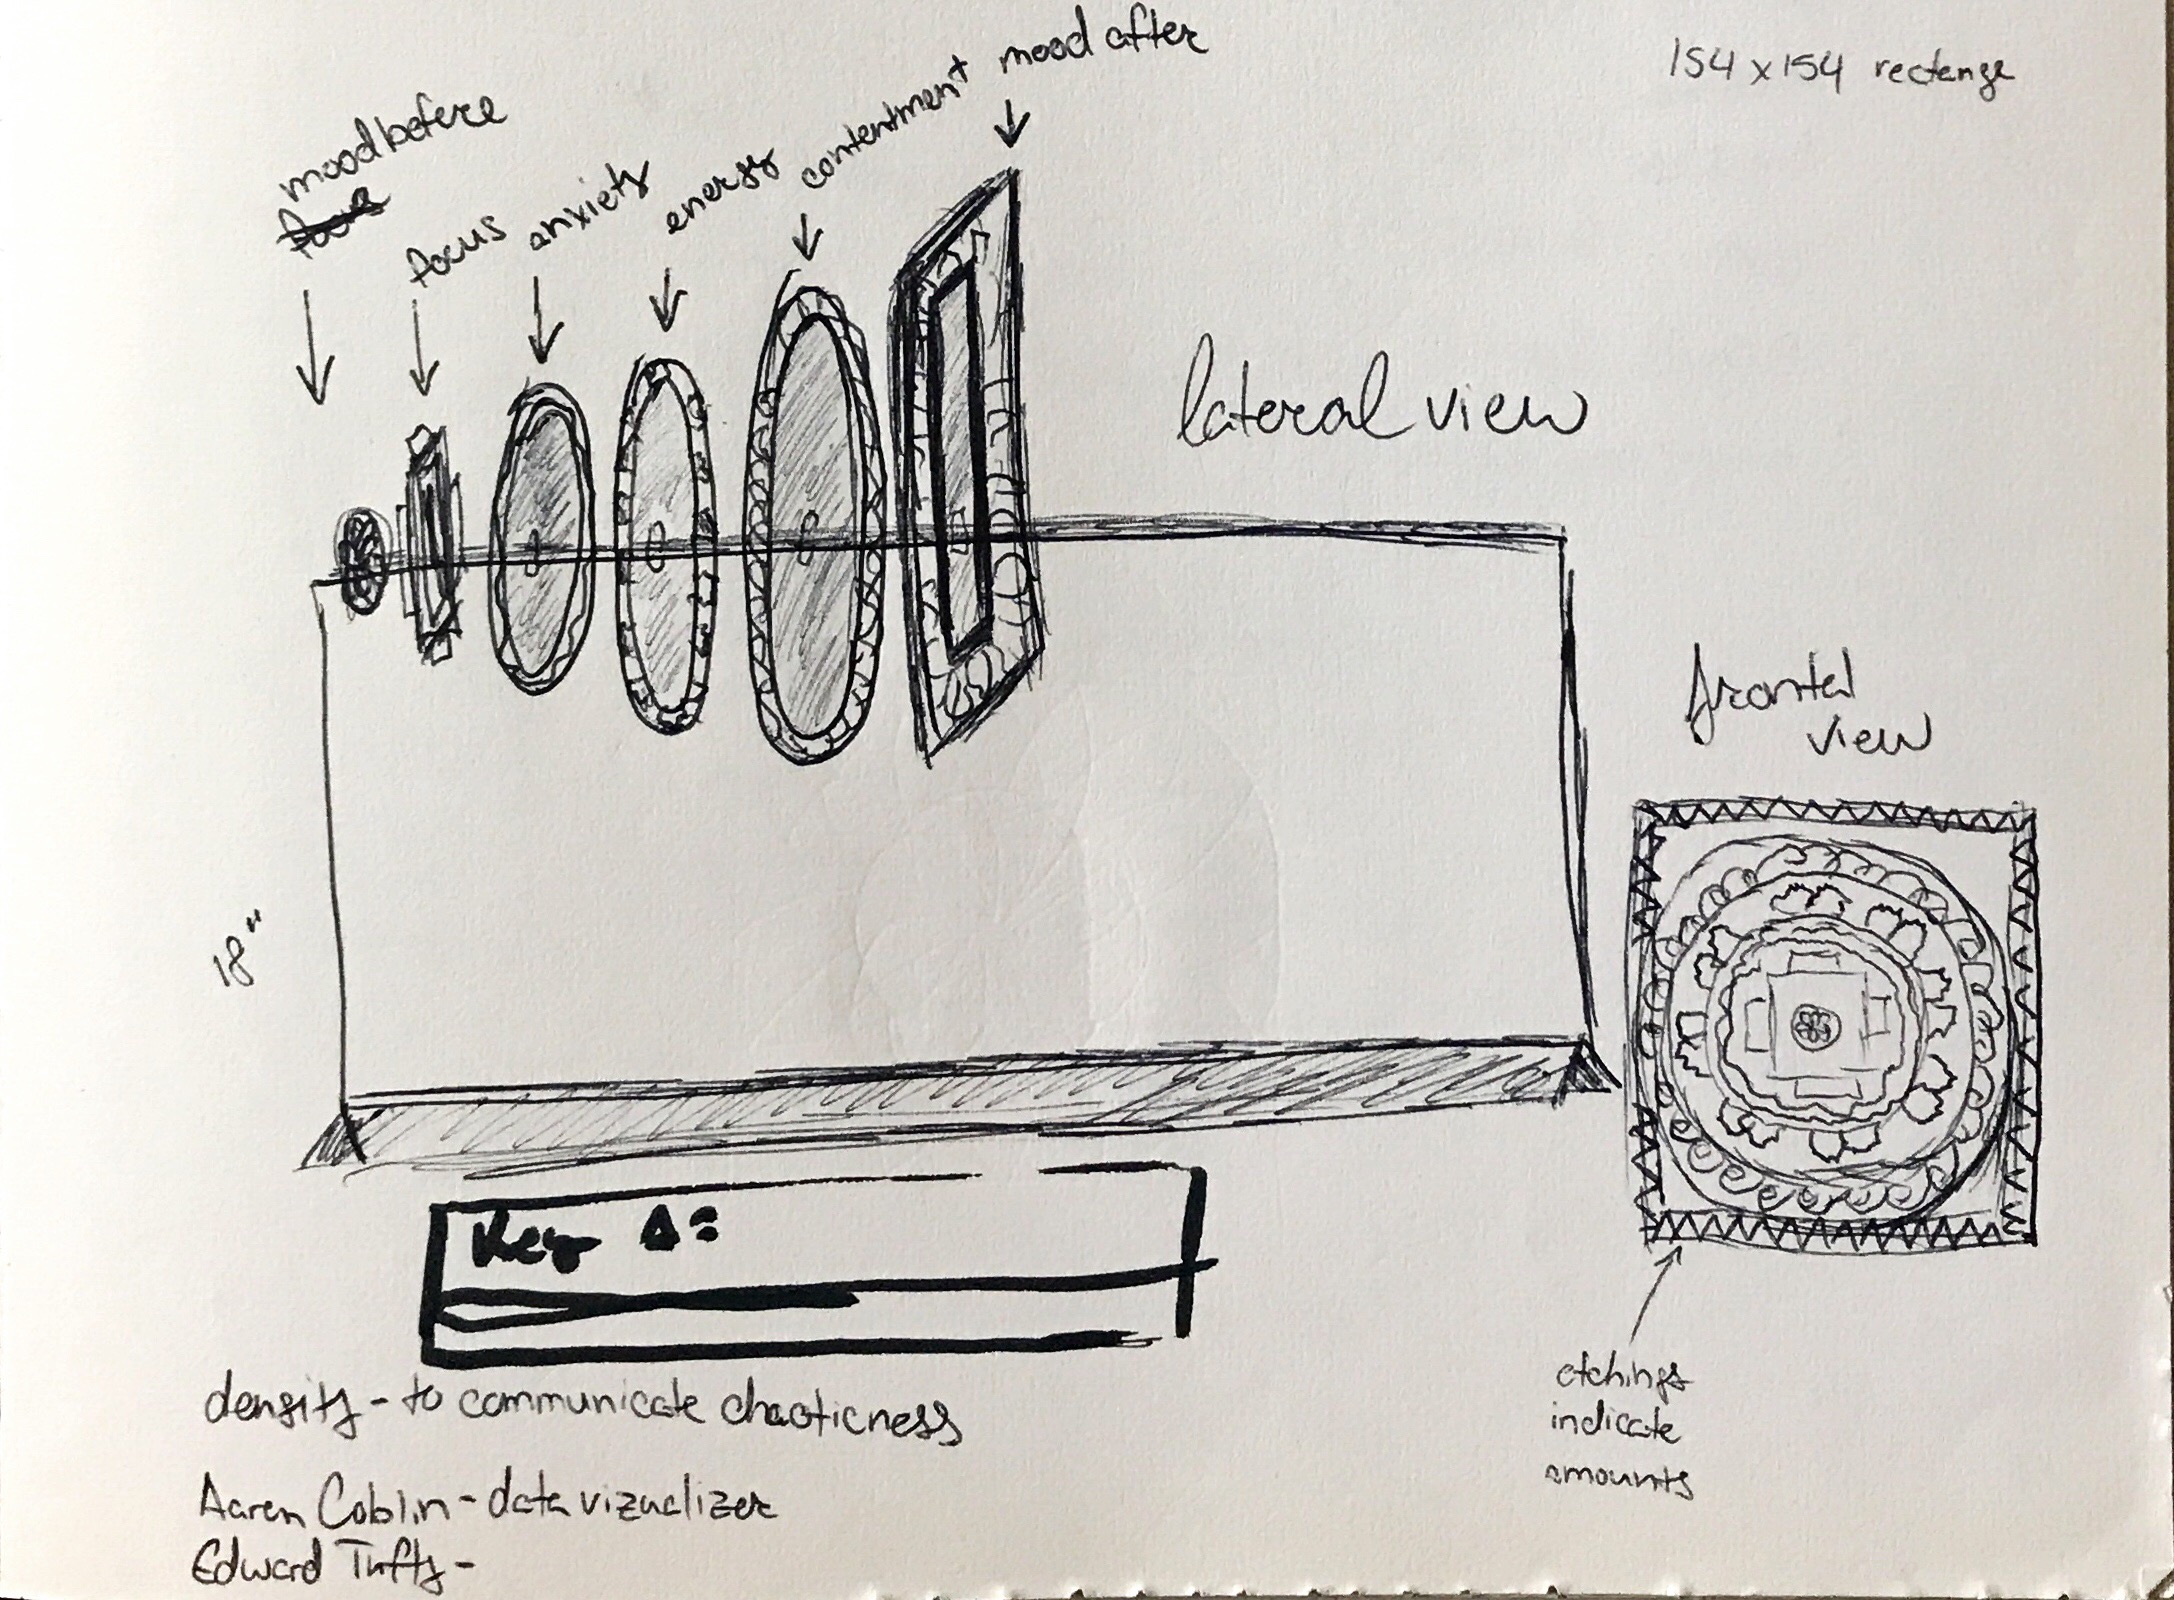
I drew on the layered nature of mandalas and decided to create sculptures that allowed the user to inspect the individual layers and assess the meaning of each. I chose a lateral display after researching principles of spatial design. Horizontal display of spatial elements tends to be a natural method for relating interconnected concepts.
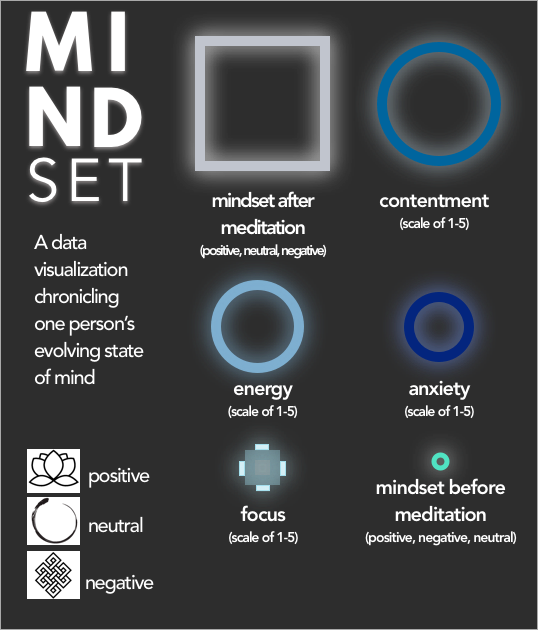
The Visual System
I took inspiration from Giorgia Lupi’s methodology for “Bruises” and created a log to record my data over the course of three weeks. I started by casting a wide net of qualitative and quantitative data and eventually narrowed my categories to the following:

Mood Before Meditation (Positive, Neutral, Negative)
Anxiety Level (Scale of 1–5)
Contentment Level (Scale of 1–5)
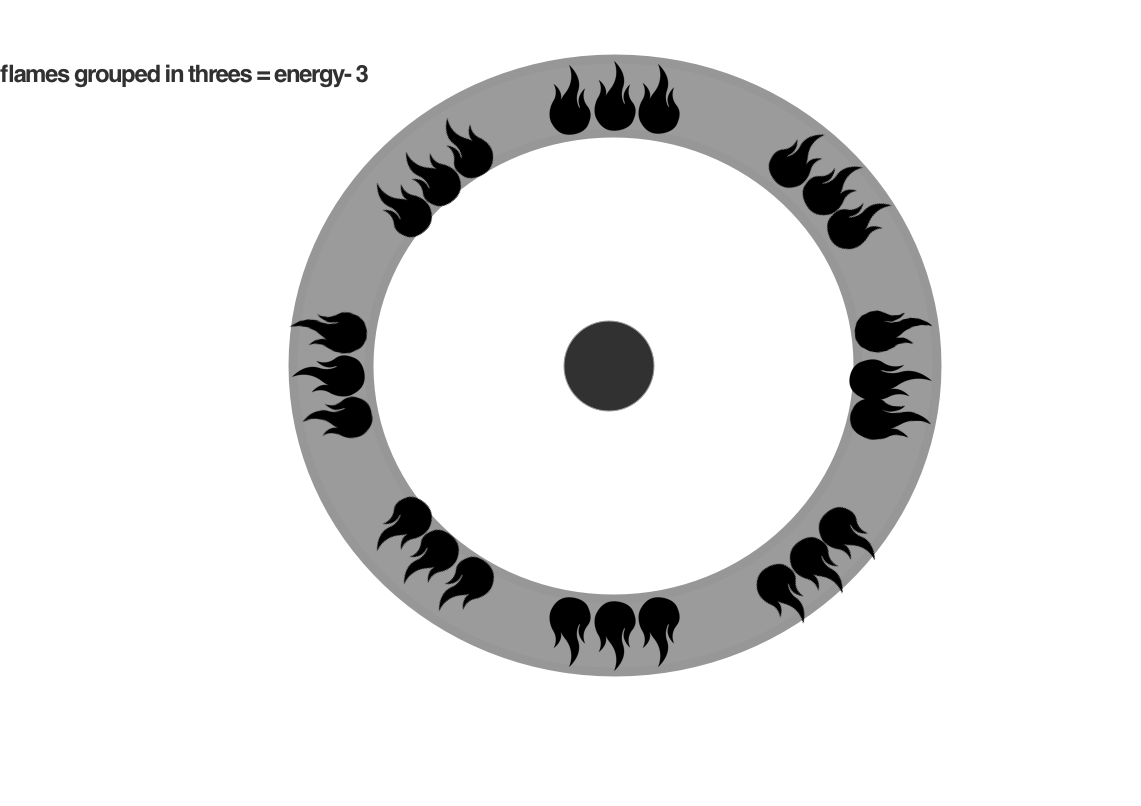
Energy Level (Scale of 1–5)
Focus Level (Scale of 1–5)
Mood After Meditation (Positive, Neutral, Negative)
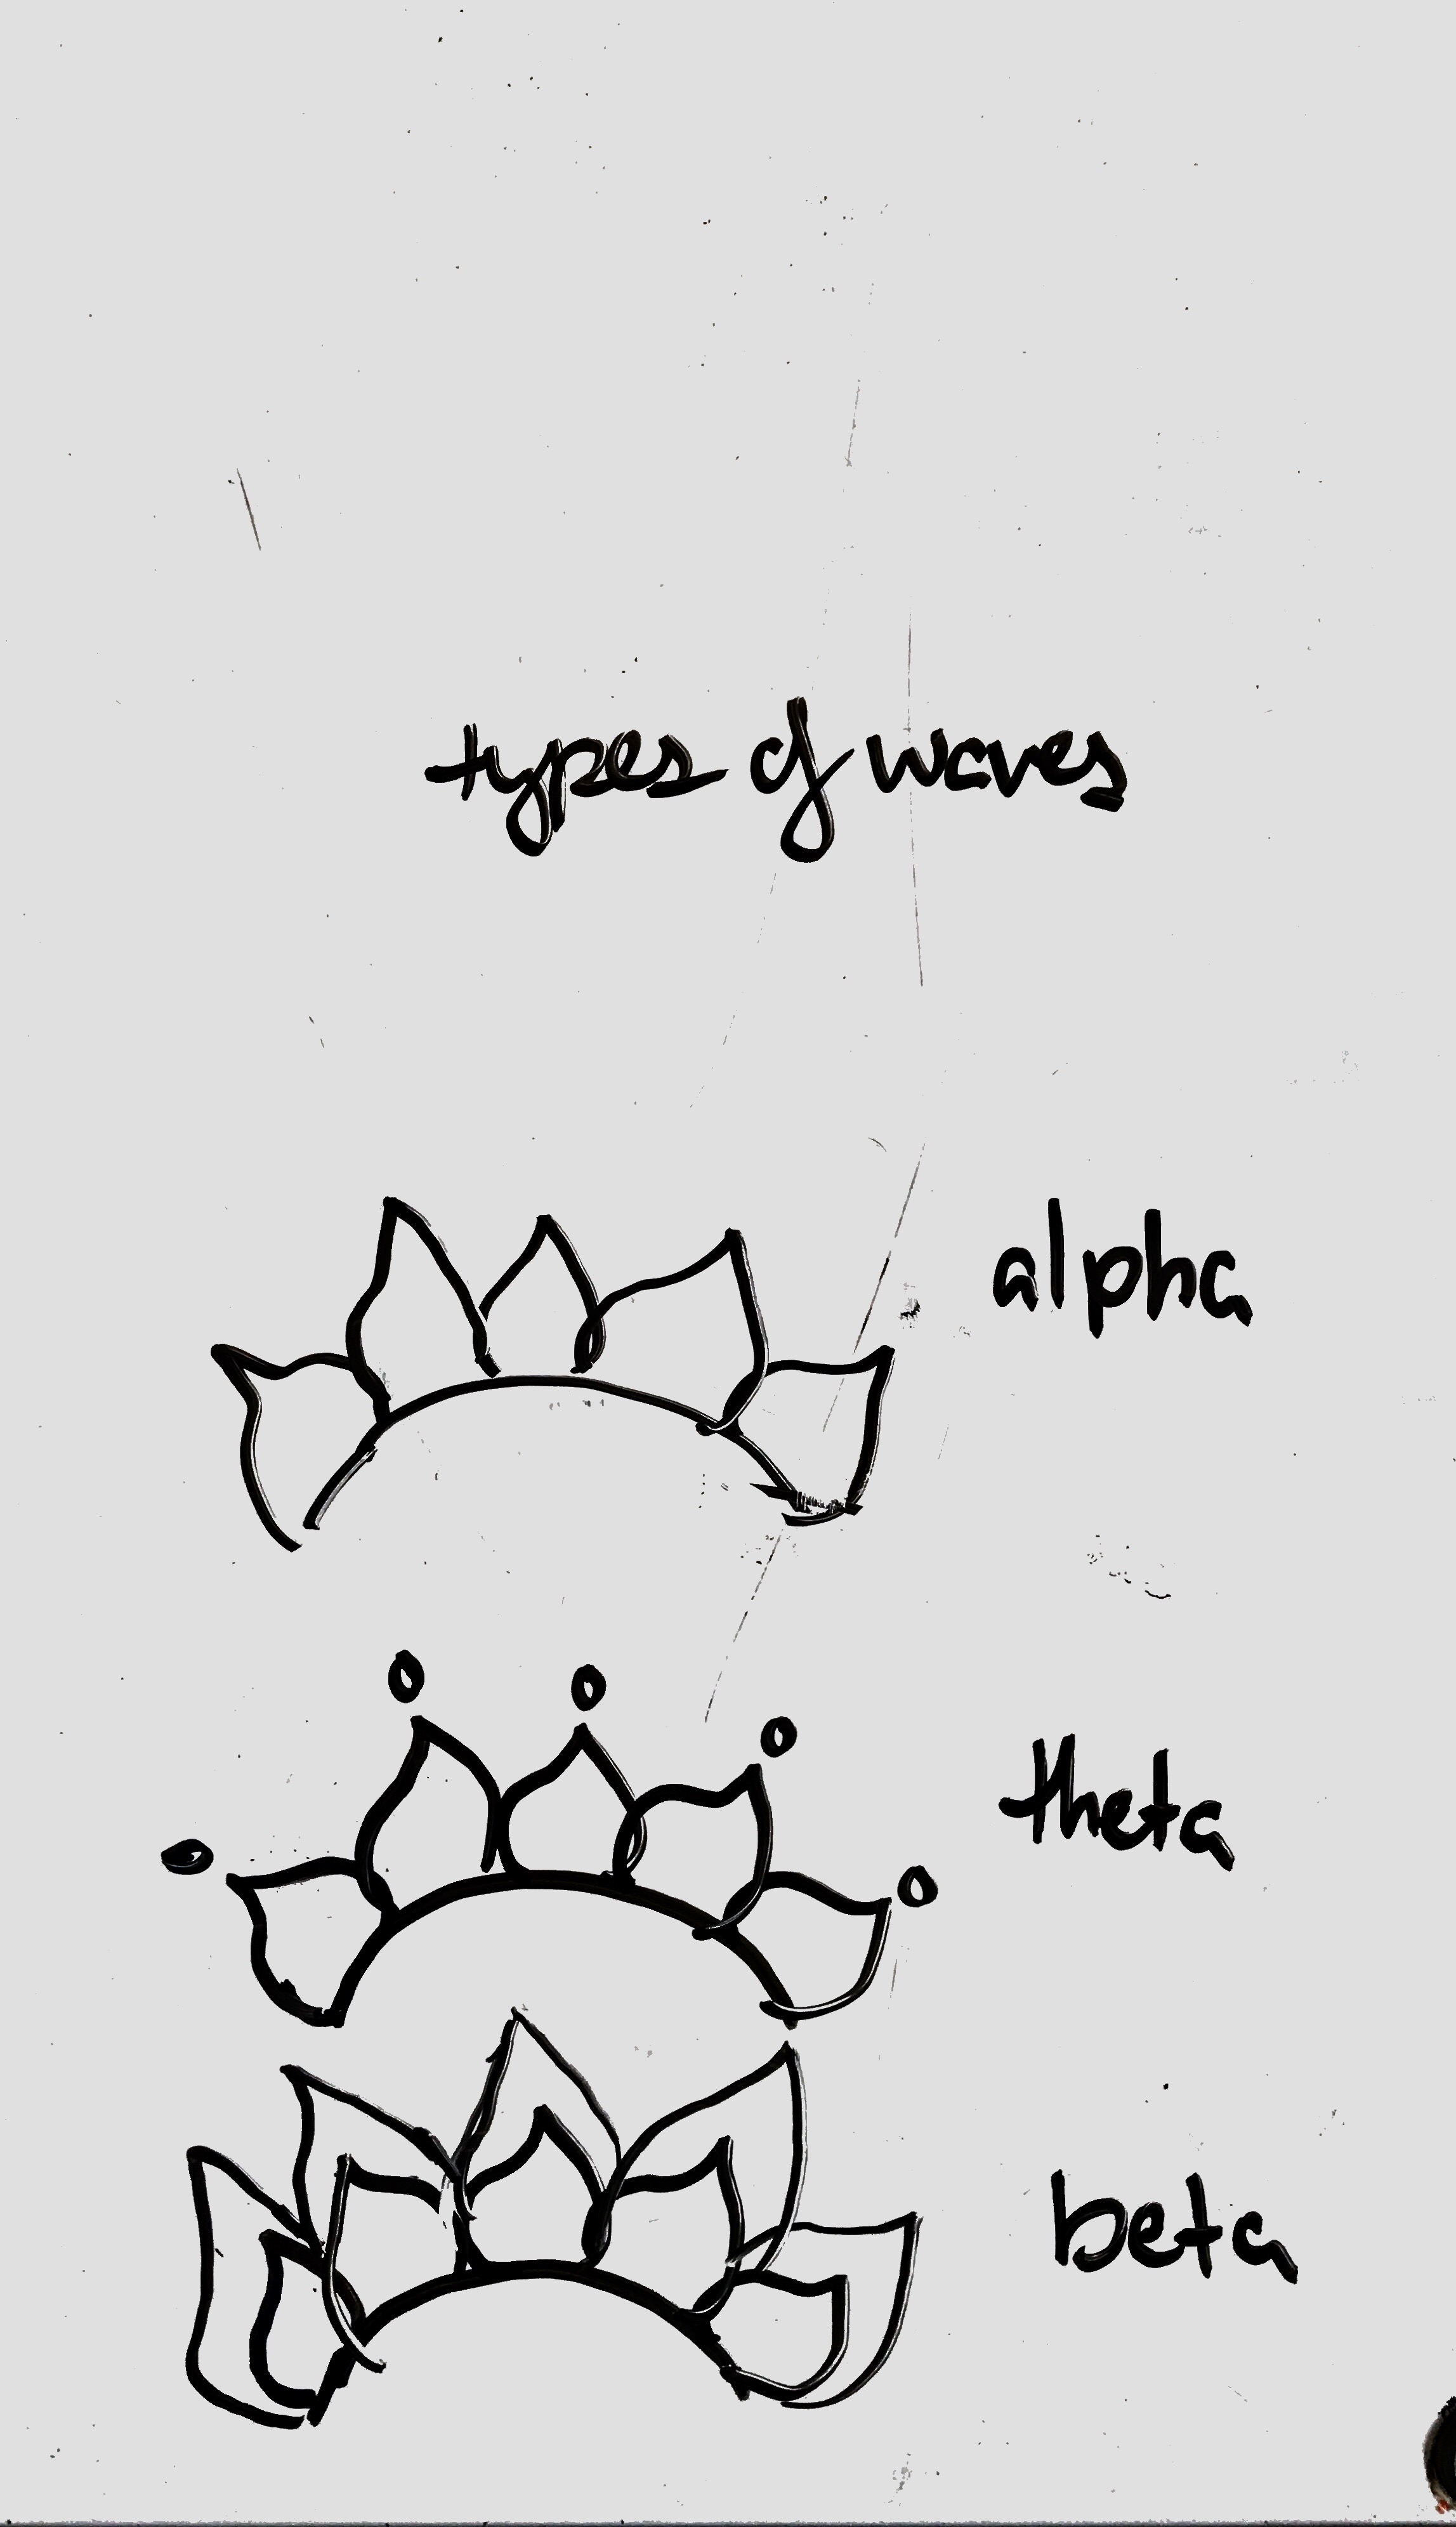
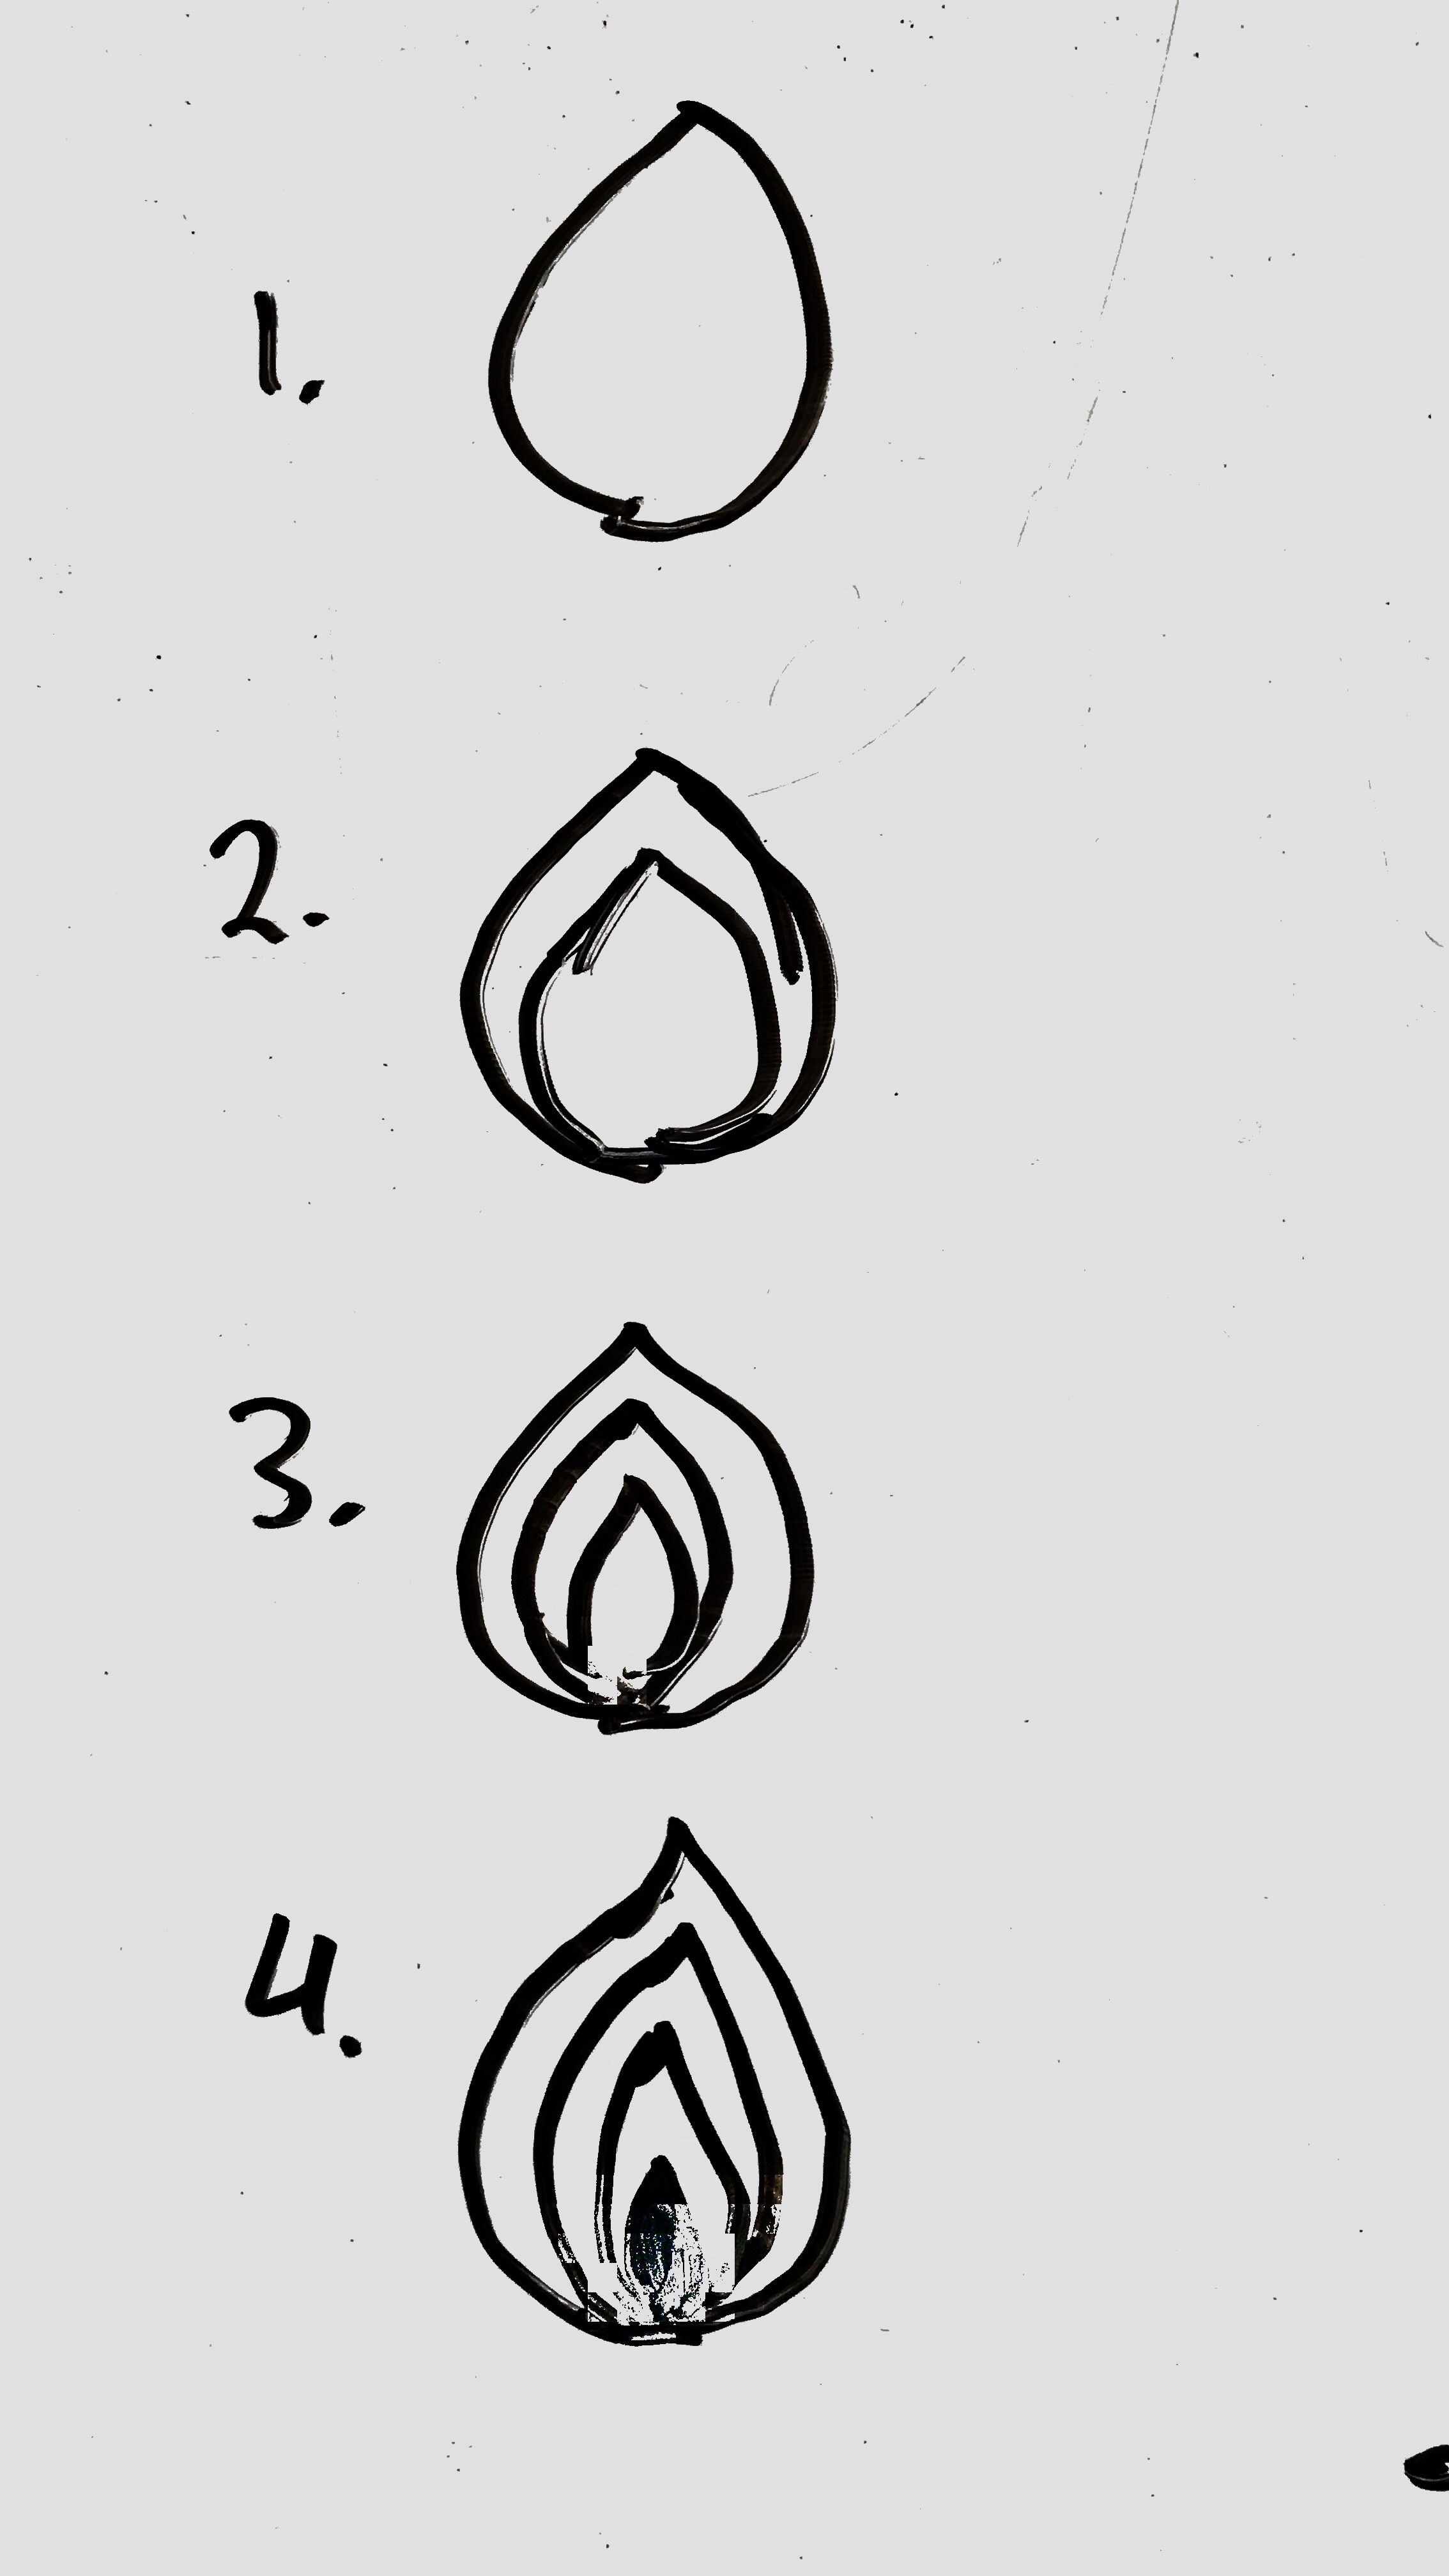
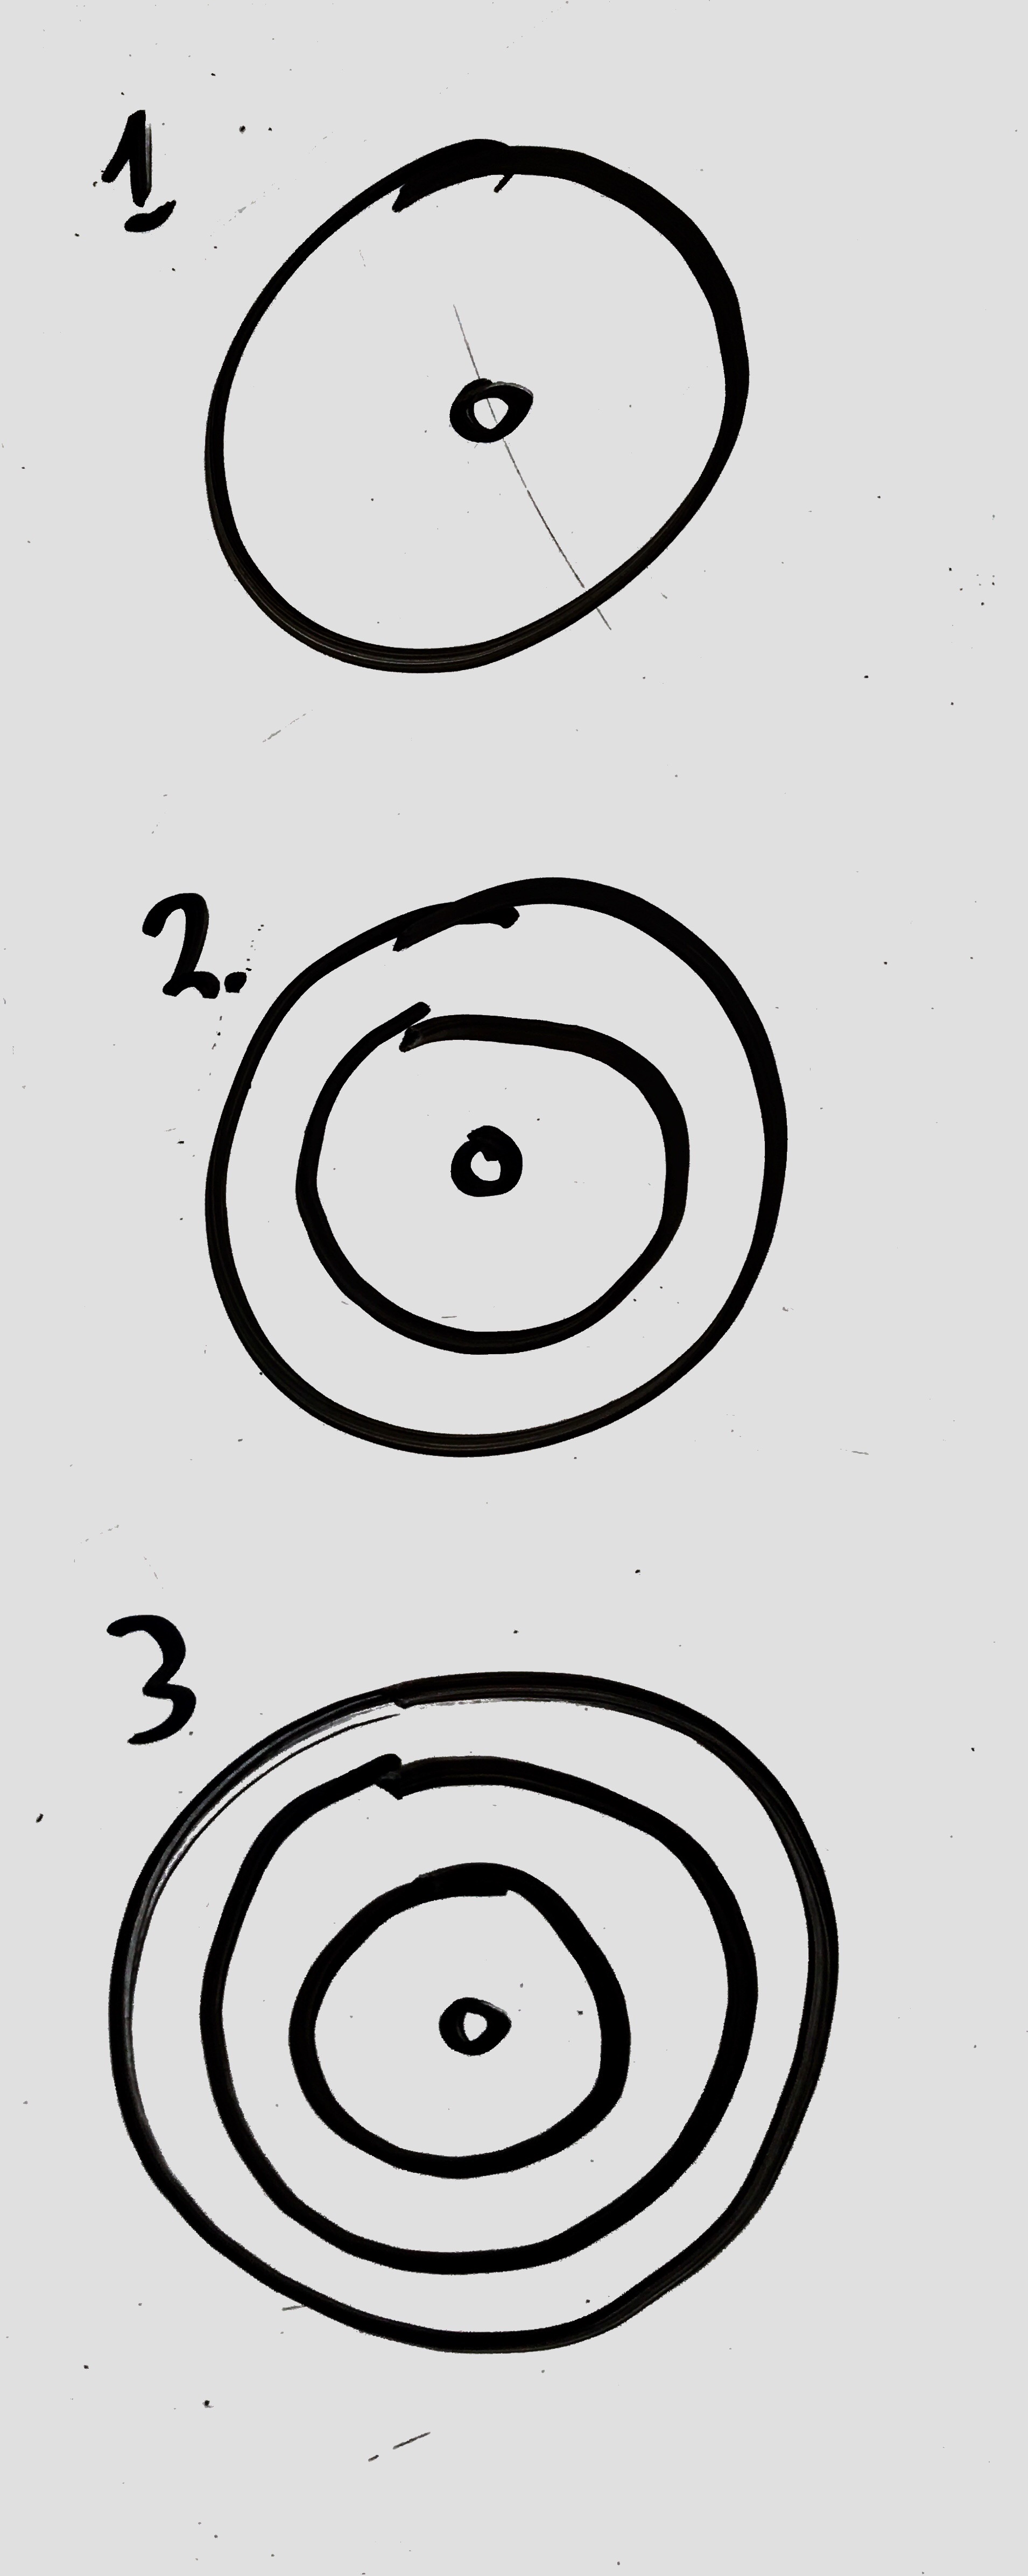
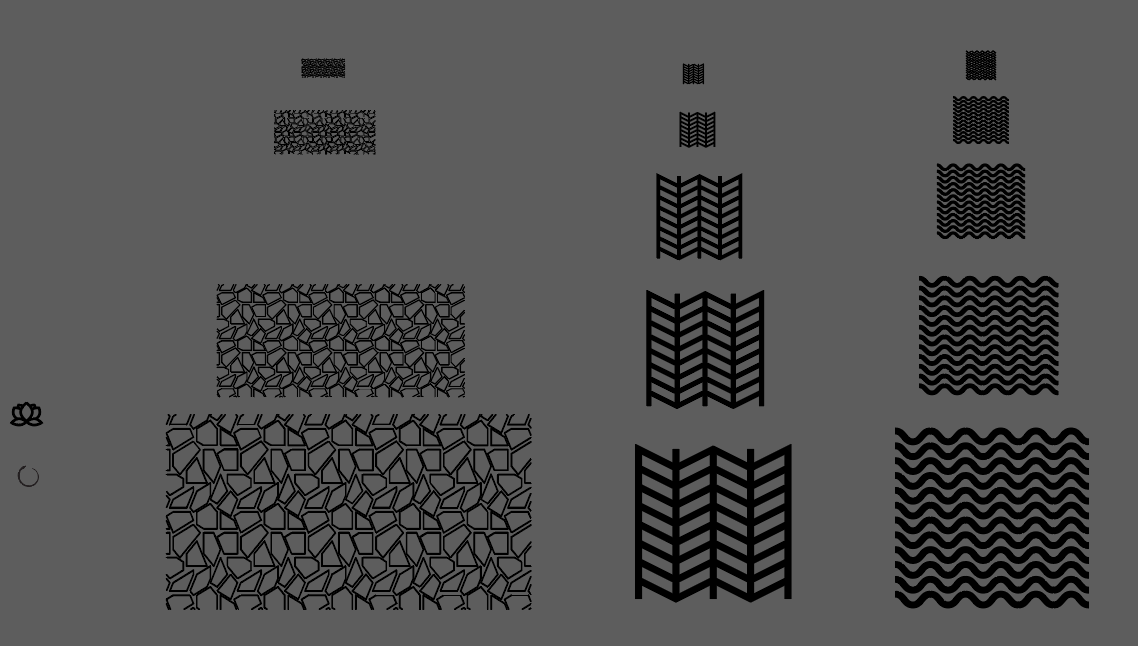
Once I knew what type of data I would be focusing on, I began prototyping different ways to visualize it. I thought about different visual systems to depict increasing magnitude while drawing inspiration from the art of traditional mandalas. Below are some early sketches.
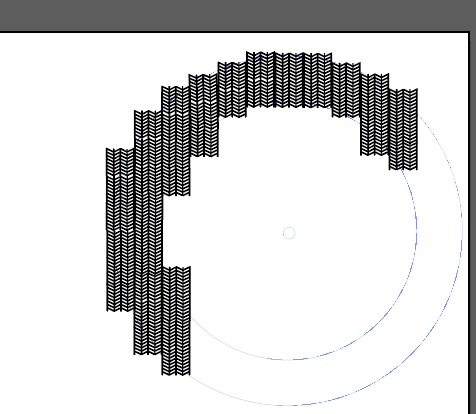
My next step was to plot some of these patterns on the mandalas. I found that sticking too closely to the original artistic depiction of mandalas was limiting. I decided to keep the structure and significance of the mandala and use my own patterns to communicate the magnitude/scale through density.
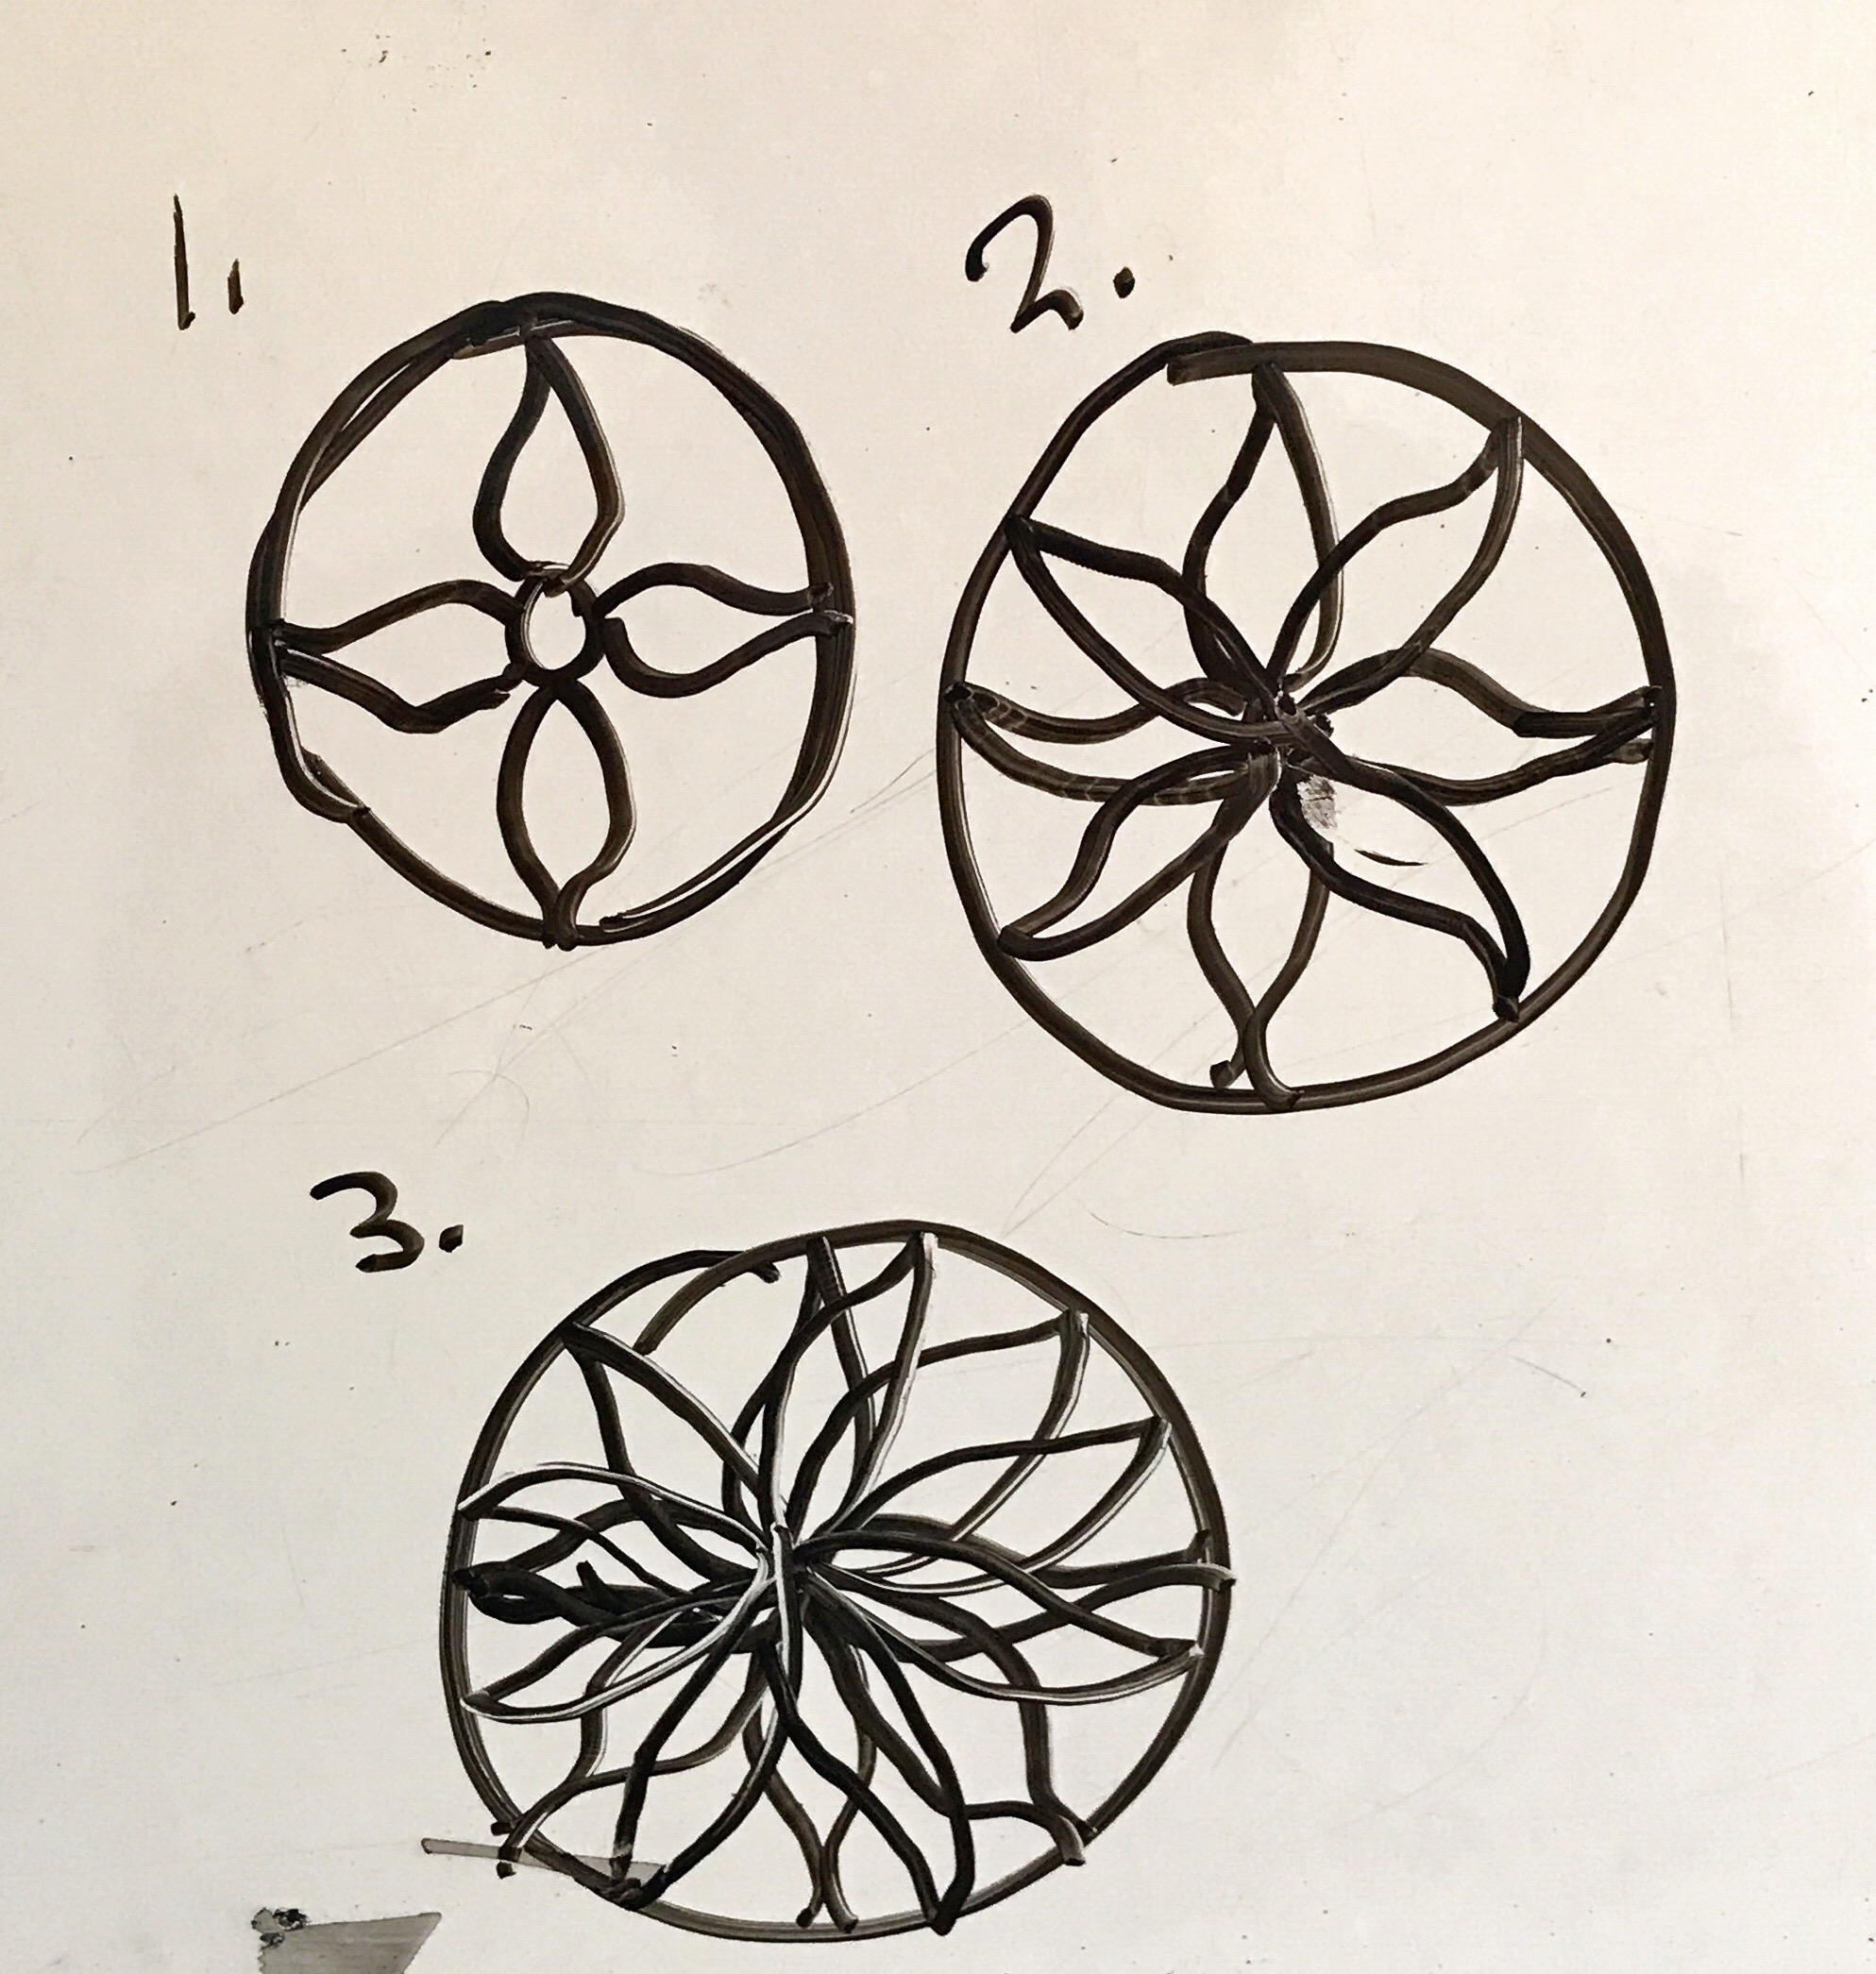
My next task was to develop a system of patterns that could be masked and engraved onto the acrylic plates. Through some trial and error, I found that the only way for the laser cutting machine to recognize my patterns was to create individual tiles and copy and paste them until the shape was completely filled.
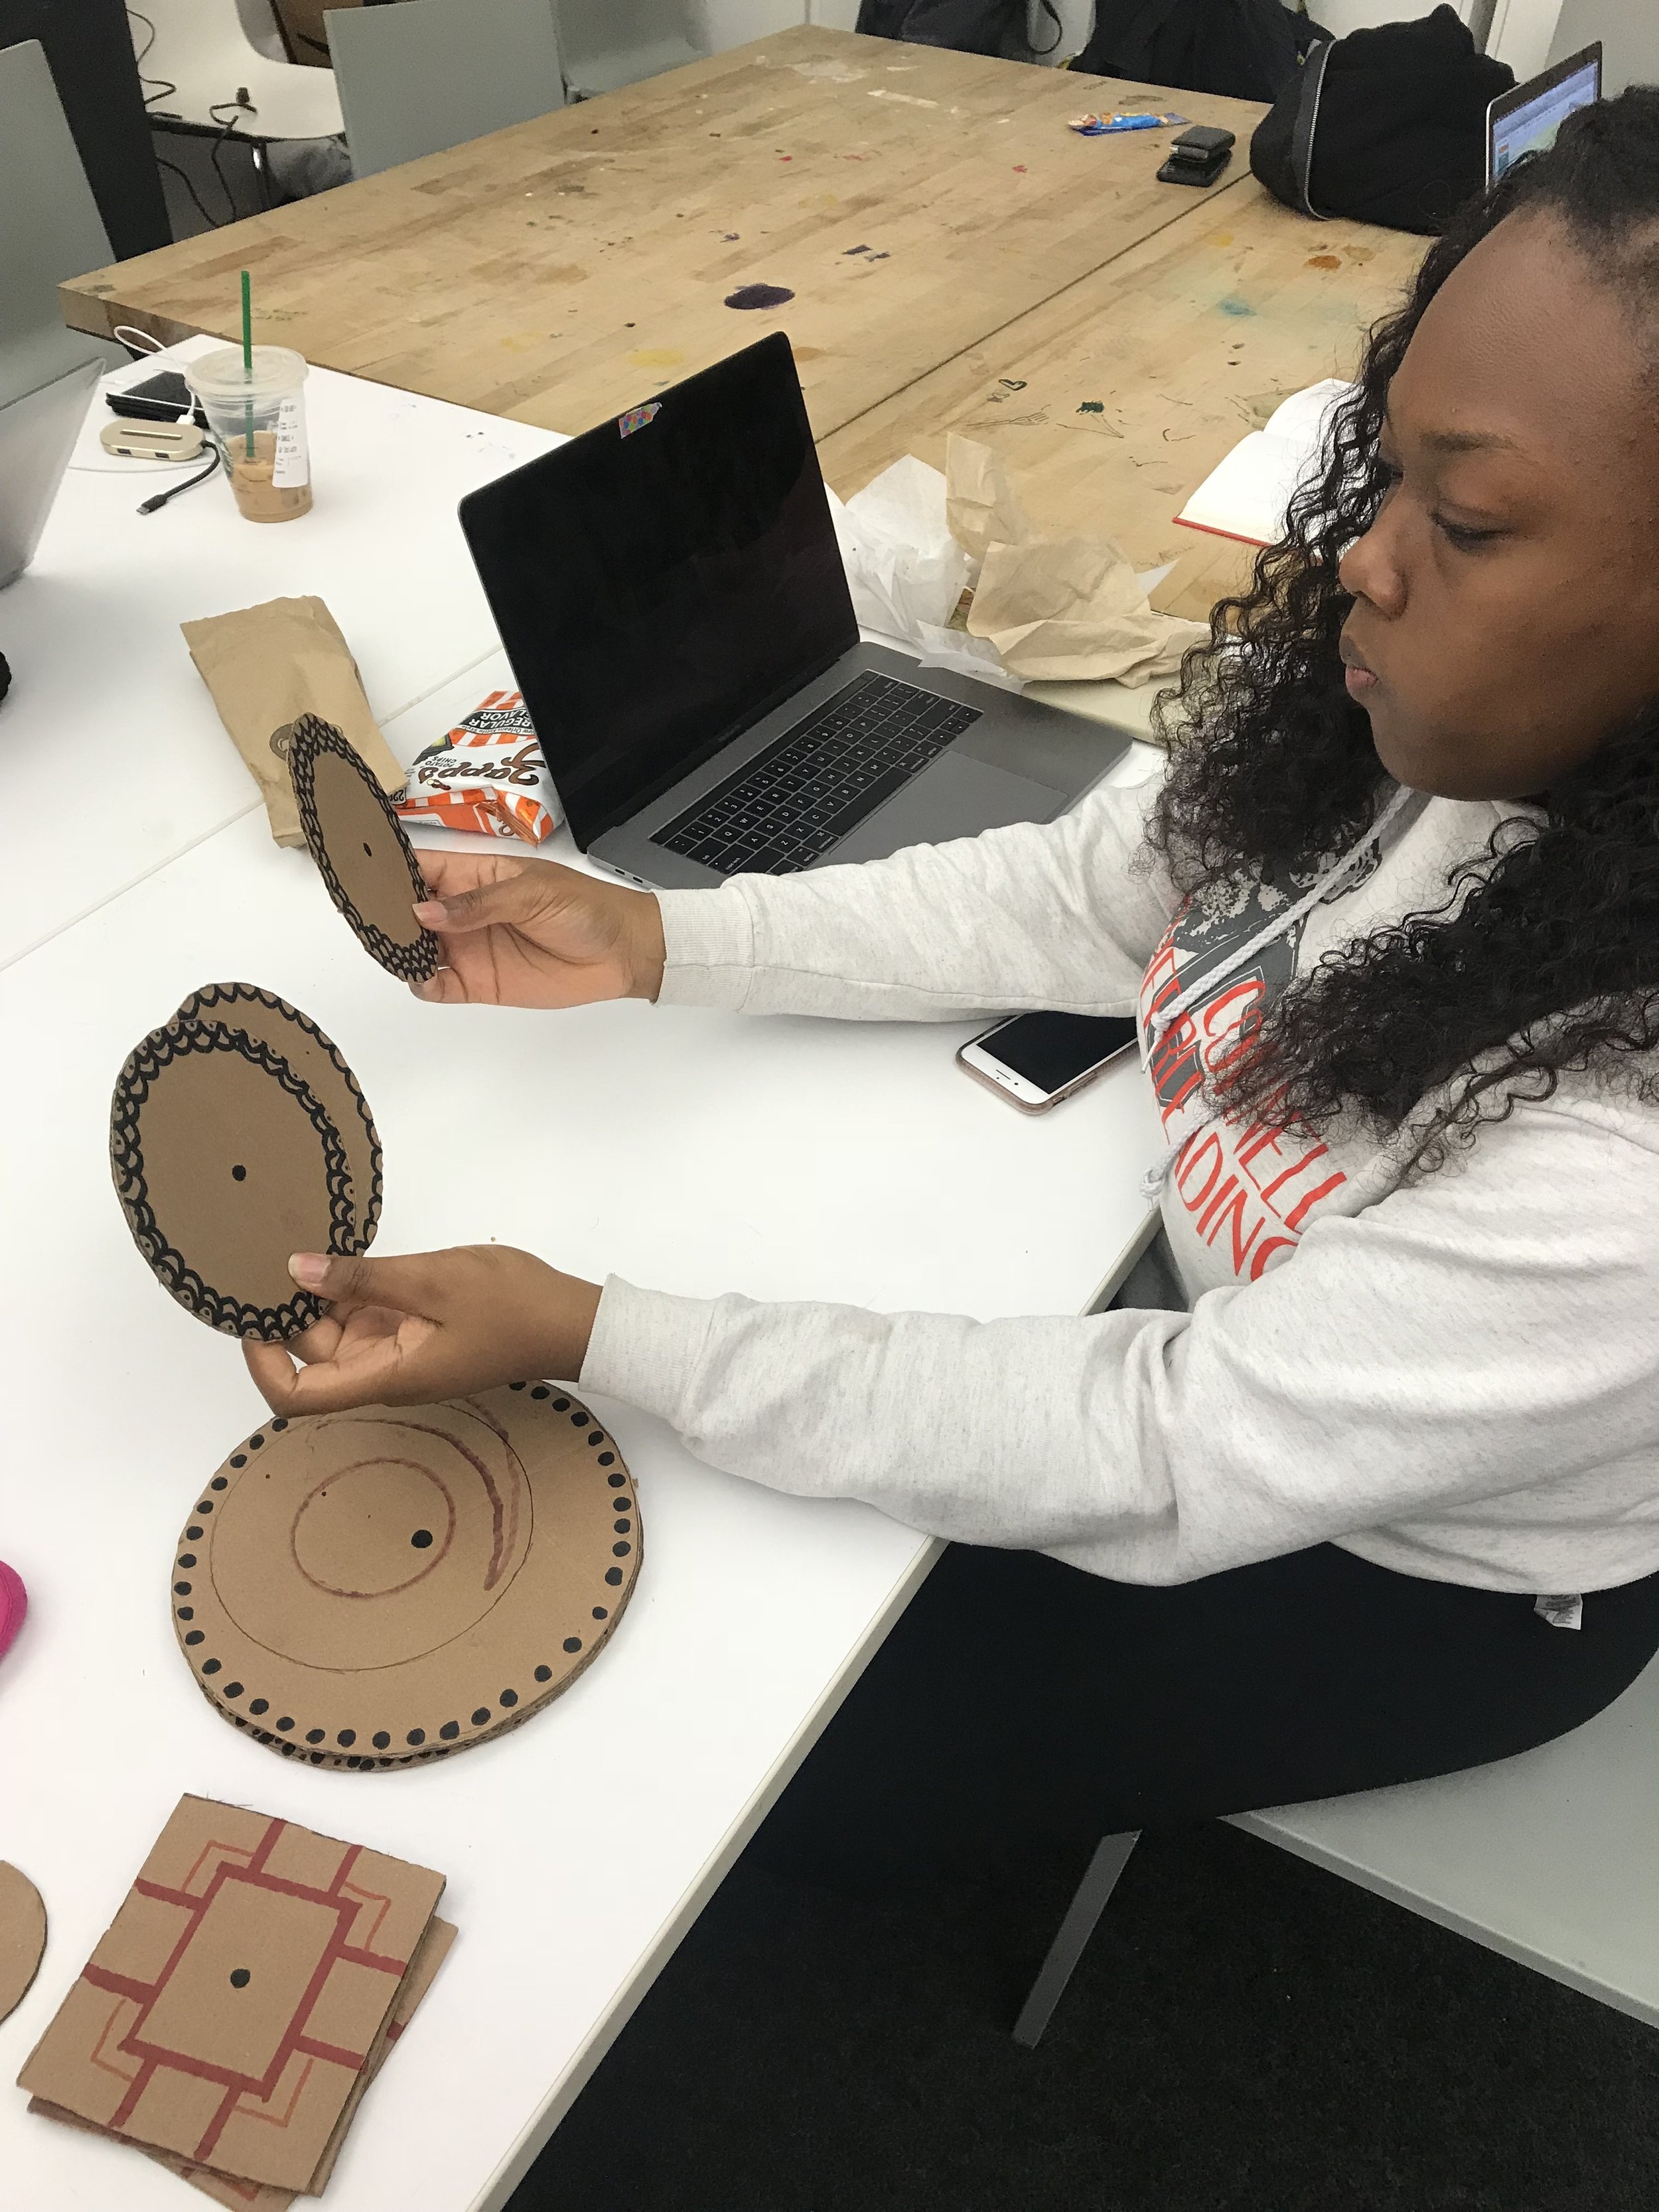
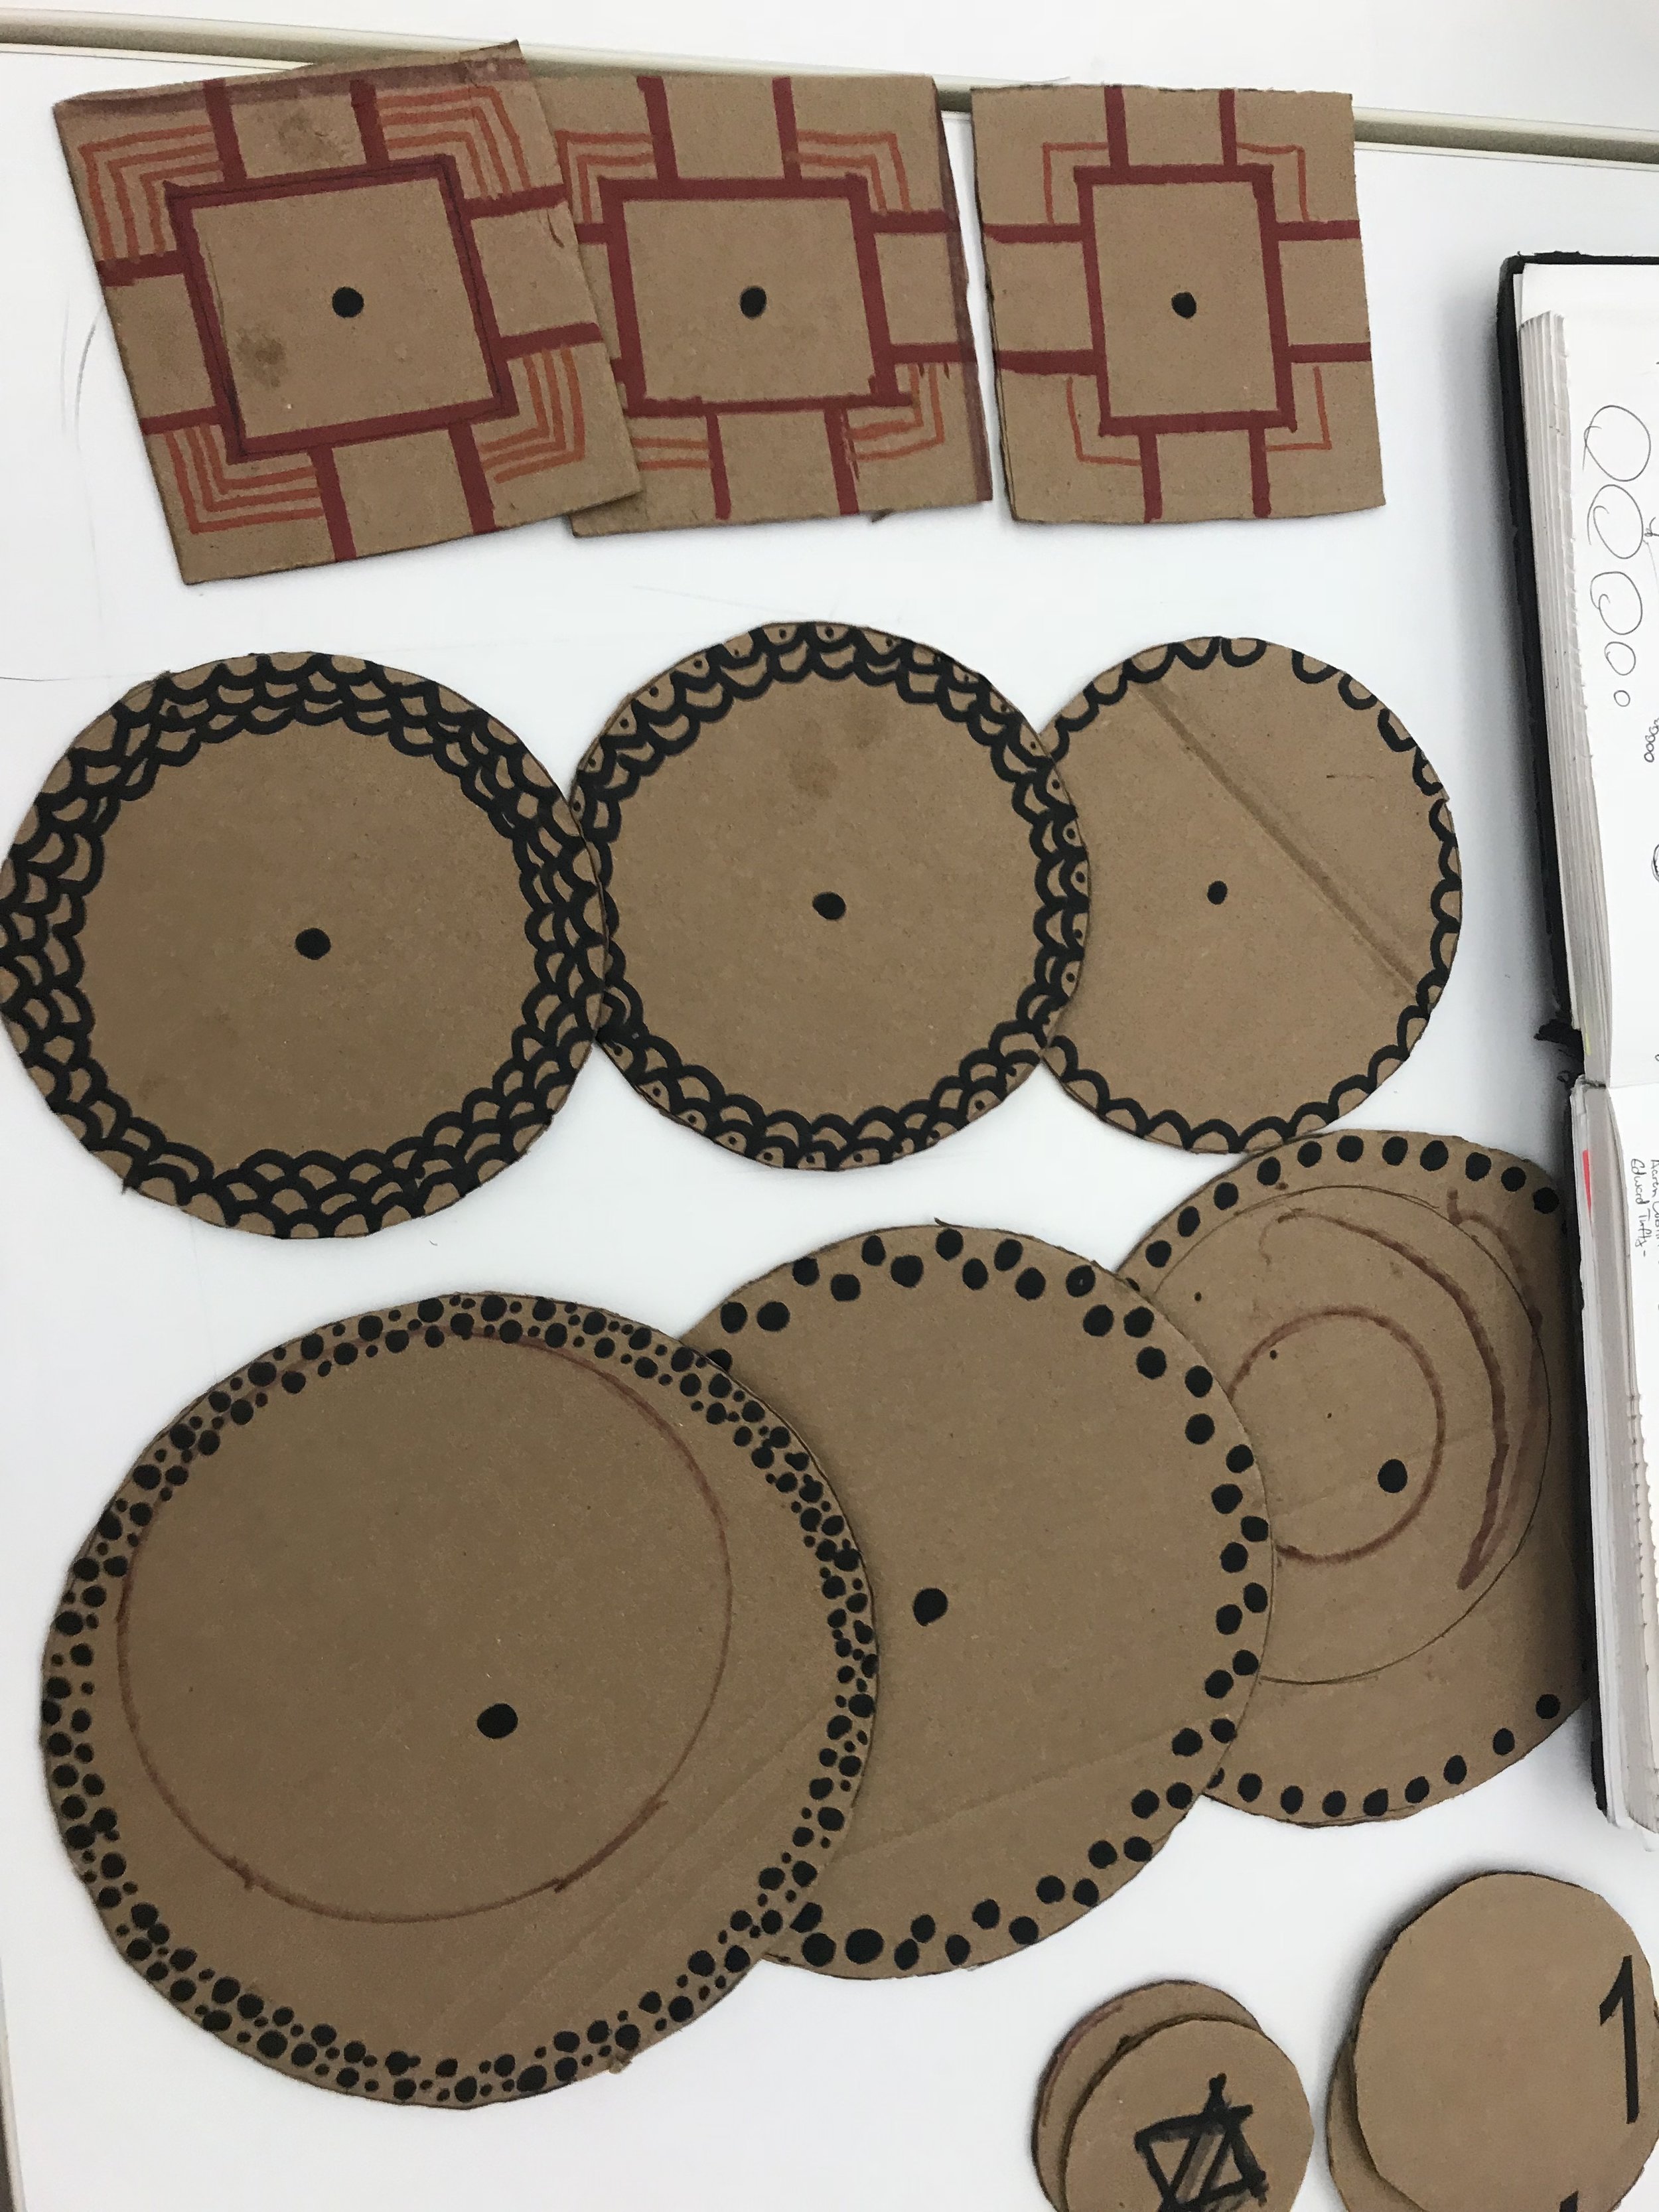
User Testing
Before finalizing the visual system I needed to test my assumption that more density would translate to higher magnitude and more importantly that the user could differentiate in terms of scale (from most to least and vice versa). I tested a series of paper prototypes on four of my classmates. All four were successful in ordering the prototypes from least to most based on the visual patterns. The only outlier was a plate where the main pattern was embellished with another pattern. This was consistently confused for representing “more” so I made a note to keep the patterns consistent and not embellish.
Construction
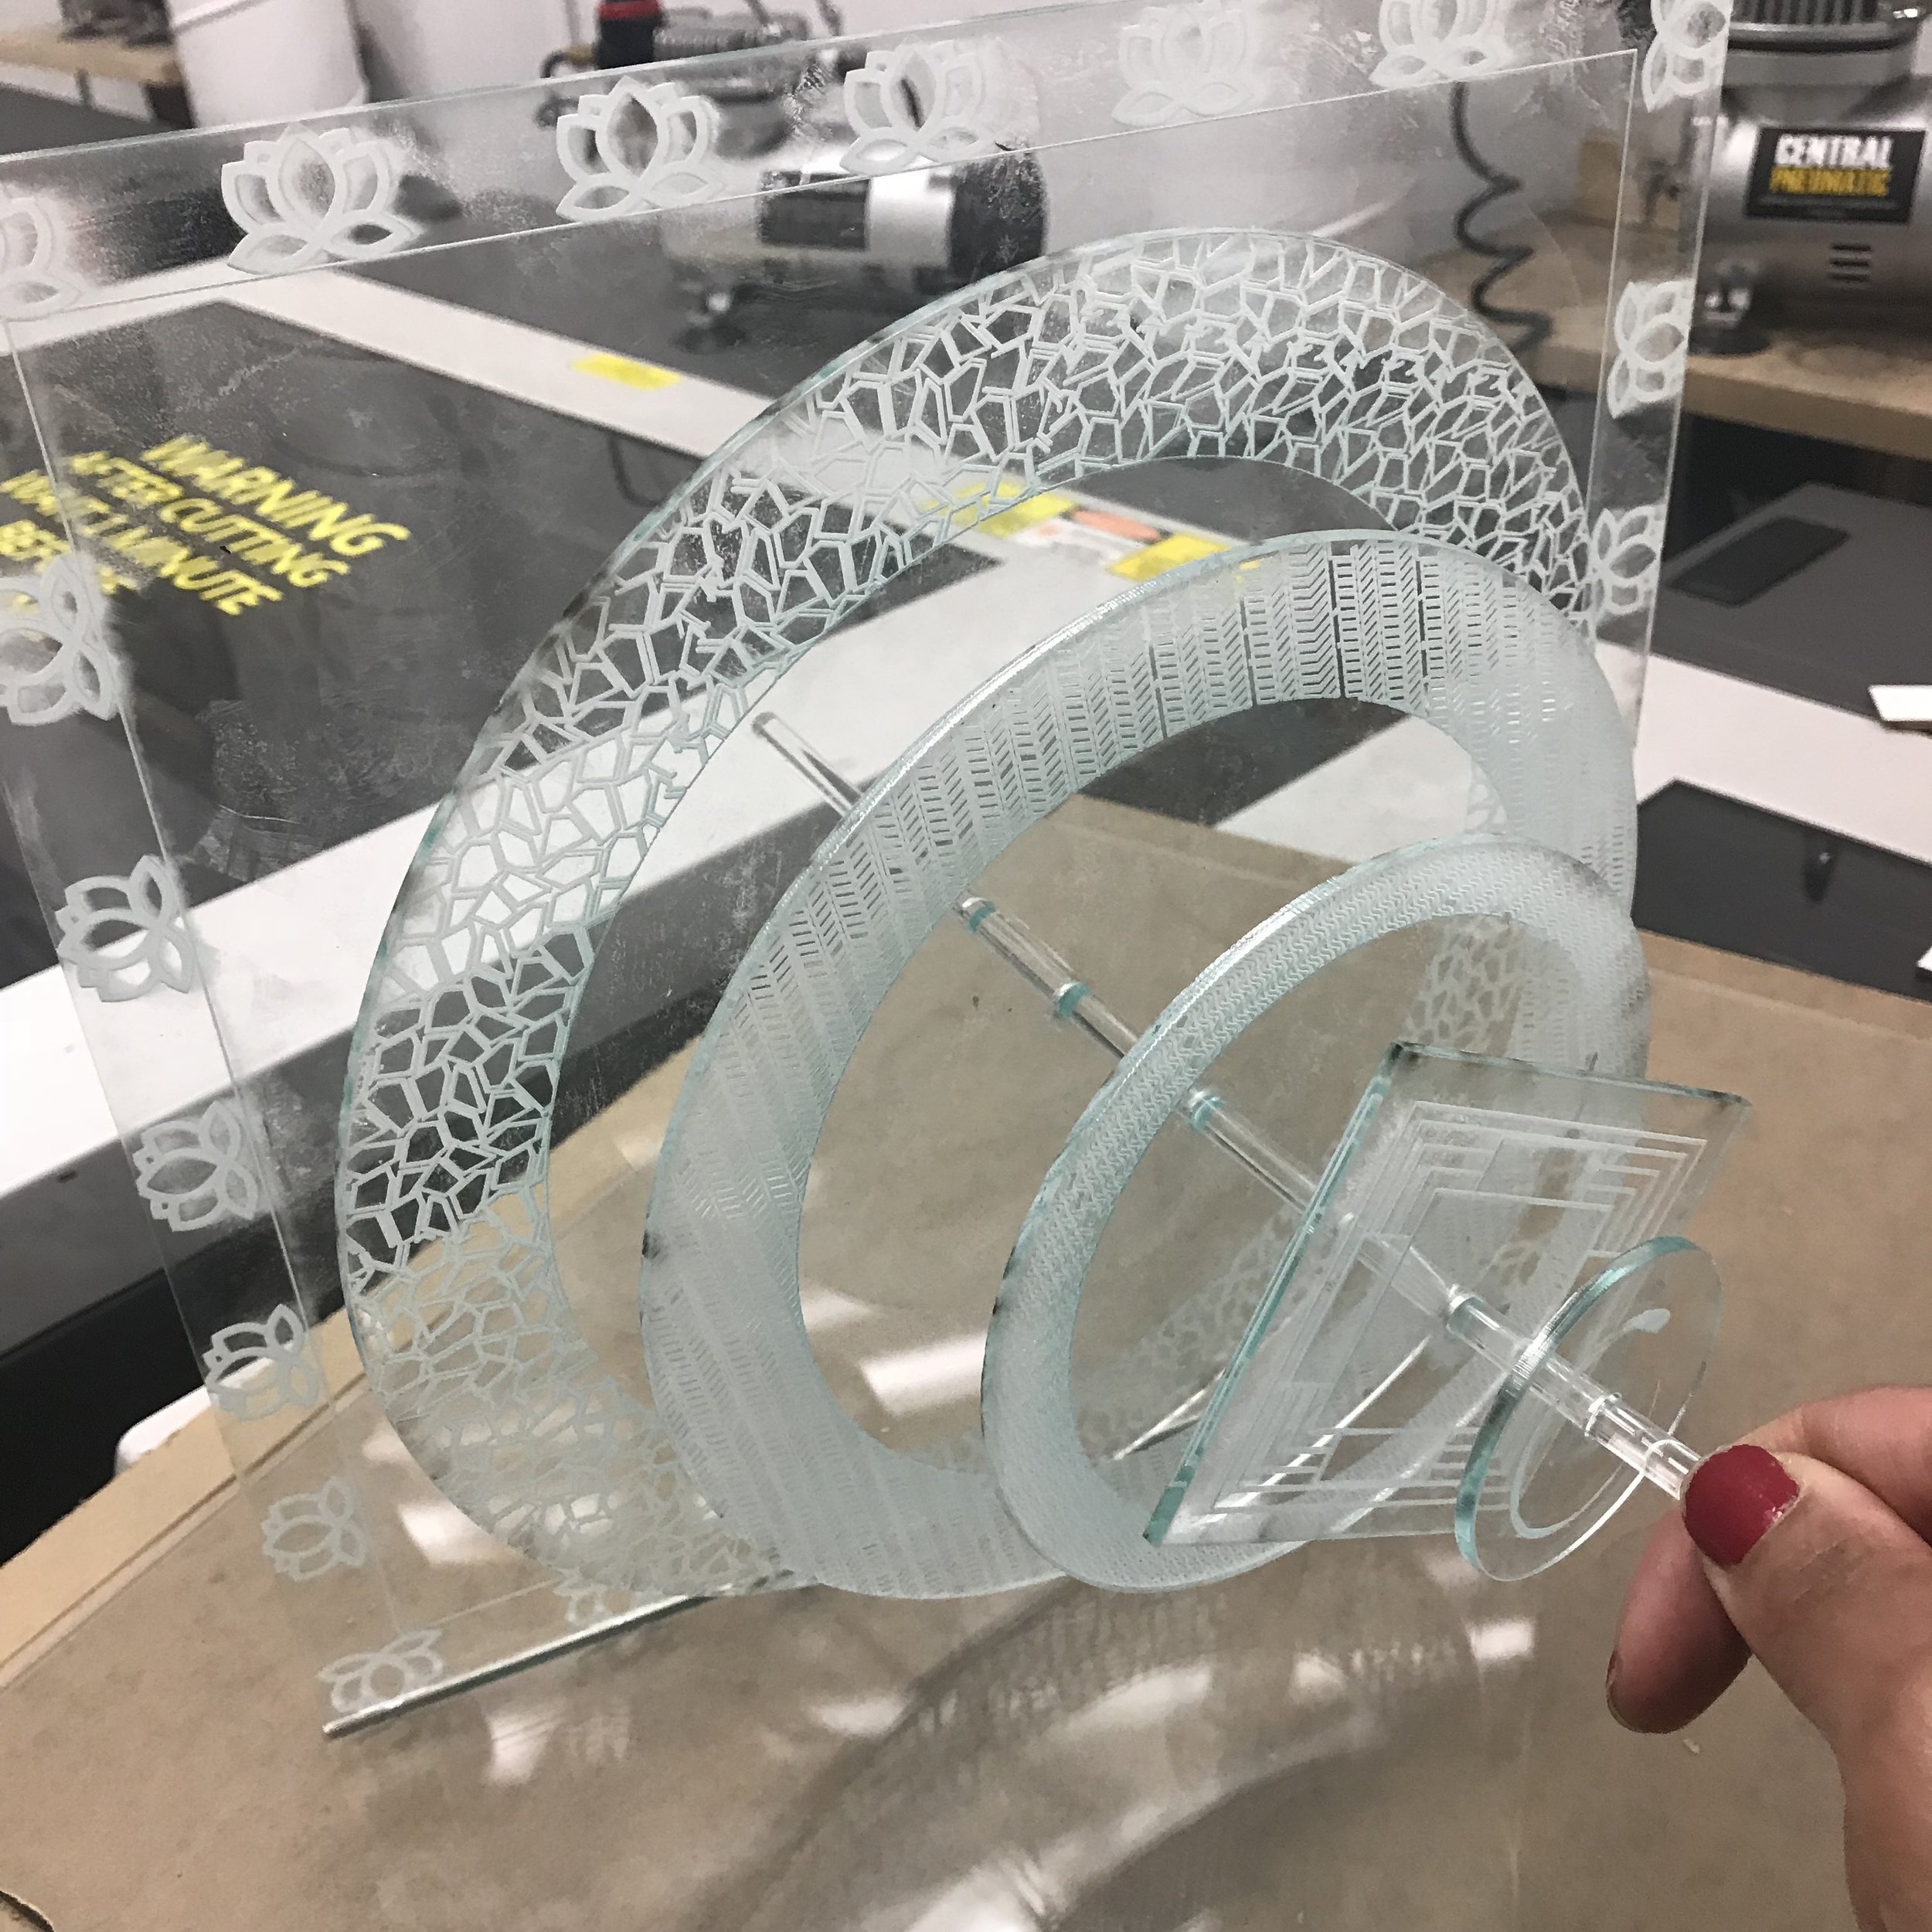
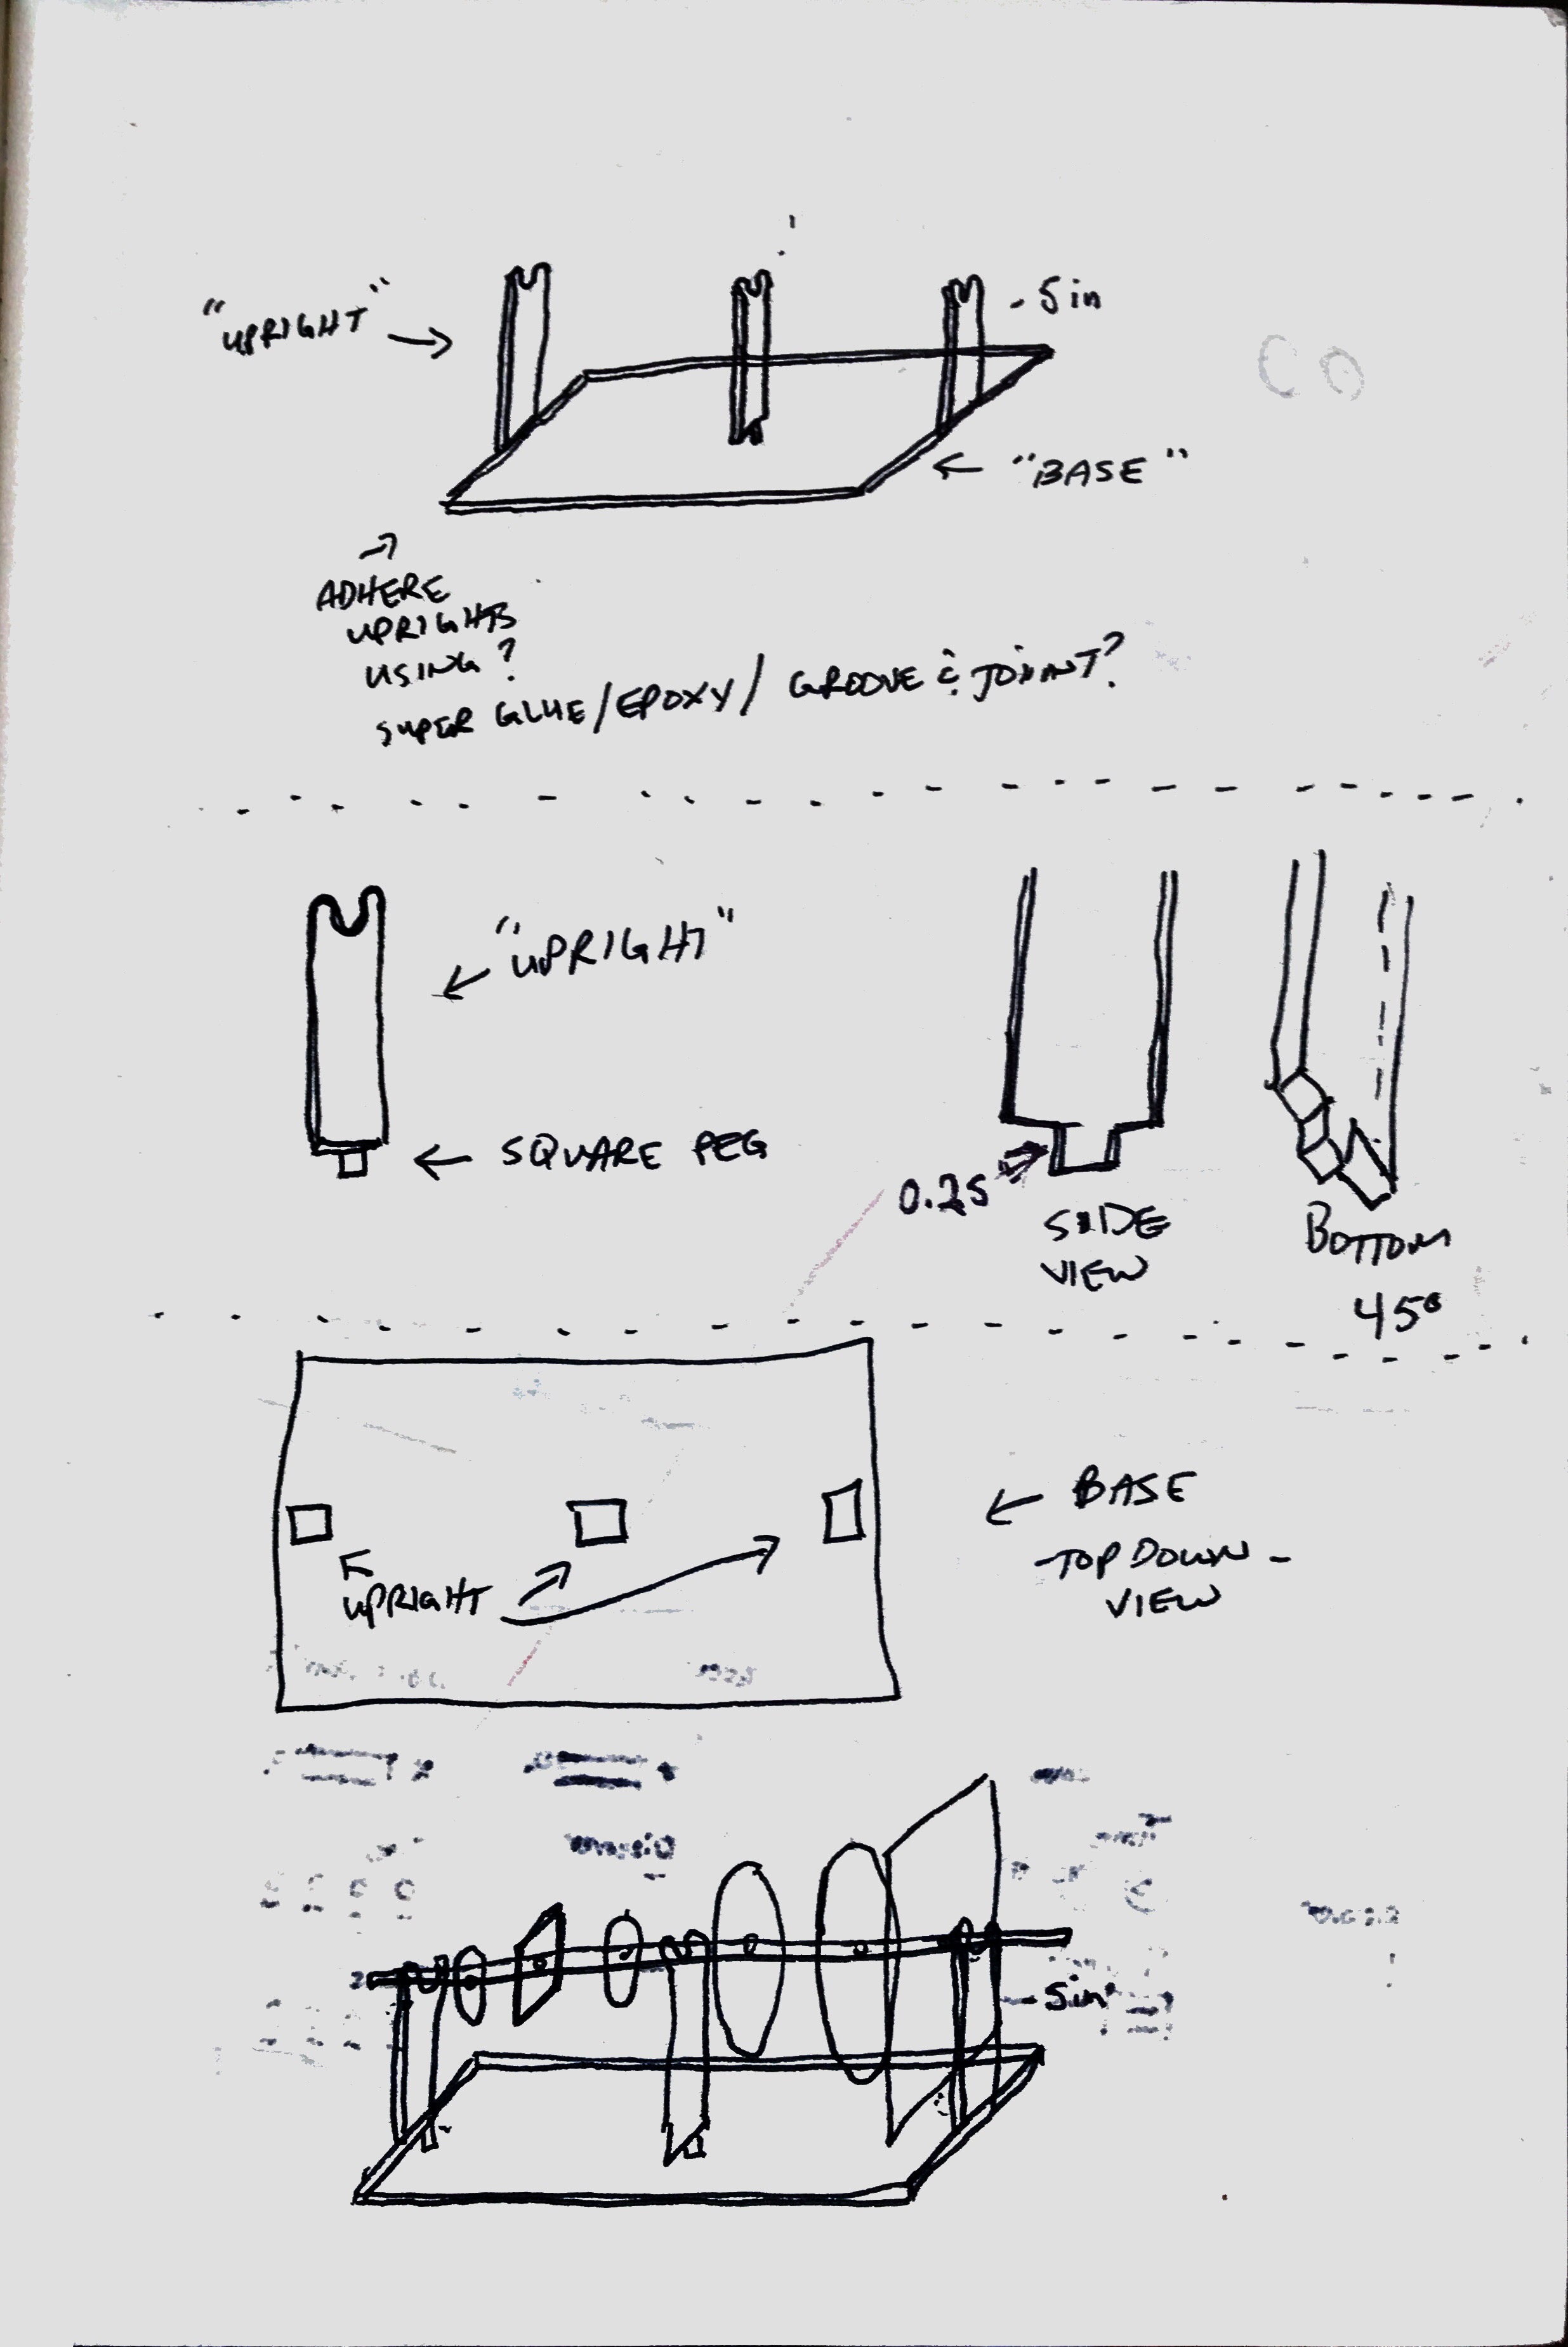
I used four 12x18 acrylic sheets to create the layers of the mandalas. I used a laser cutter to cut out the shapes and etch the designs onto each shape. Then I cut and bonded acrylic brackets that used to brace the sculpture on the center axis. This was my first experience with making so a friend helped me develop a schematic to mount the plates laterally.
Augmented reality with unity and vuforia
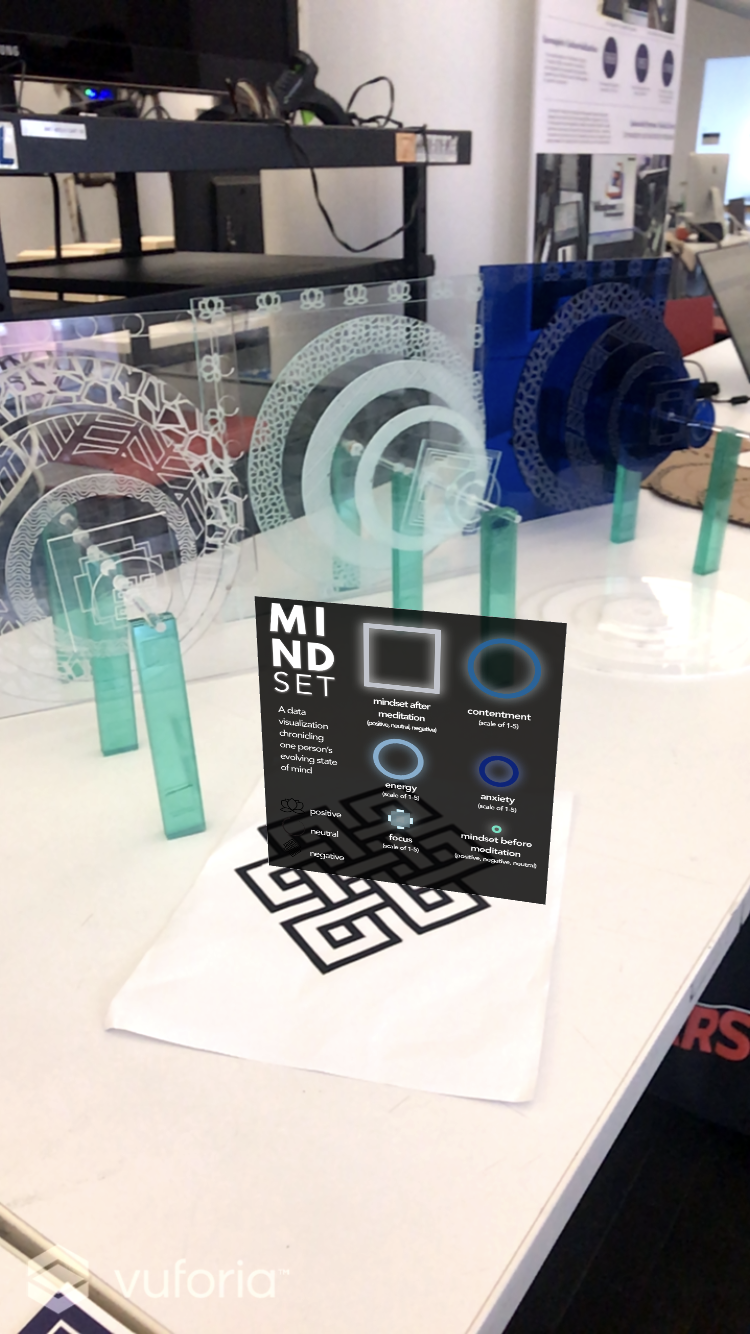
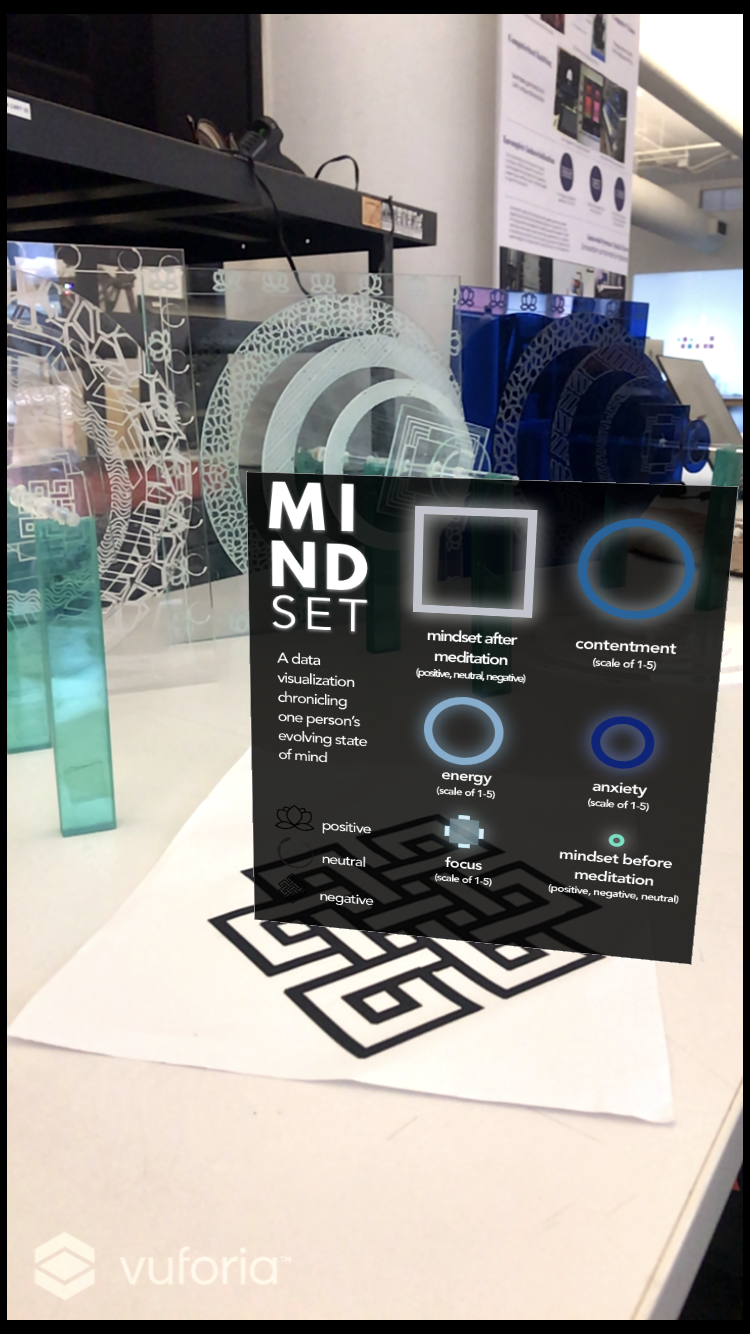
While I was constructing the sculptures, I shifted my focus to developing the key that would be used to decipher the significance of the mandalas. As I mentioned, I envisioned the sculptures being put on display in a casual setting. I wanted to add a level of interactivity that would reveal the true meaning of the sculptures so I decided to develop an augmented reality key.
Initially, I envisioned a user scanning the sculpture and then an AR overlay appearing that would explain the significance of the different layers of the sculpture. I quickly realized that the sculptures themselves didn’t have enough contrast or defined lines and edges for the computer vision to recognize the target and render my AR experience. As a workaround, I printed out a high-contrast, geometric image to lay at the base of the sculptures and demo the AR.
I’d never worked with AR before so I sourced some tutorials from my classmates. Vuforia and Unity came highly recommended. These tools are free and there are a ton of resources out there so I would recommend them as well, especially if you don’t have much experience with app development. Unity will create an app for you and if you’re an iOS user, all you need is Xcode and it will build right on your phone. I can’t stress enough how helpful my classmates were to me in executing this component of the project. At one point, I had five different classmates gathered around me all trying to help me figure out the same bug fix. I have to give a special thank you to my classmate Ke Ding who solved the issue that six other people couldn’t.
Finished Product
After a month of recording data and what felt like an endless amount of hours at a laser cutter, I displayed three sculptures that stood as representation of my fluid state of mind.
I displayed the sculptures and demo’d the AR during my program’s yearly final project exhibition. Feedback was positive, although the AR was a little finicky. Overall the sculptures read as delicate and unique. People were able to pick up on the nuances of each sculpture. It was interesting to have people point to the sculpture on the far left and say things like “So that was a bad day?” It was but I found myself appreciating that bad day because of the sculpture.
Reflection
I tried a lot of firsts with this project. It’s rare for me to take on such an artistically influenced design and even rarer for me to share such a personal journey. When I watched people inspecting each sculpture, they were inspecting me on my deepest level. It was an act in vulnerability. Posting this is an act of vulnerability but I firmly believe that vulnerability makes room for growth. I had an enormous amount of support from my classmates at all points of this project. I was very thankful for my D12 community and always will be.
I’m still intrigued by the idea of visual systems for abstract concepts. I think it could be enormously helpful in more practical spaces like psychology. I’m curious how this approach might apply to people with speech impairments or autism. This project encouraged me to continue pushing the bounds of how we tell stories with data and I intend to continue this exploration in my thesis.